The influence of contrast polarity during reading
Purpose. The aim of this study was to investigate whether subfoveal choroidal thickness (SFCT) changes after 30 minutes of reading at a distance of 40 cm. In addition, it was investigated whether normal contrast polarity (black text on a white background) and inverted contrast polarity (white text on a black background) during reading have different effects on SFCT.
Material and Methods. In this prospective crossover study, 36 young adults aged 18 to 30 years participated. To control for possible order effects, participants were divided into two groups. Group A first read a text with black letters on a white background and subsequently the same text with white letters on a black background, while in Group B the order was reversed. Each condition lasted 30 minutes at a distance of 40 cm. SFCT was measured using optical coherence tomography (Spectralis OCT, Heidelberg Engineering, Heidelberg, Germany) in enhanced depth imaging mode. Measurements were taken at baseline and after completion of each reading condition. Normality was assessed using the Shapiro–Wilk test. Depending on data distribution, paired t-tests or non-parametric tests were applied. In addition, a repeated-measures ANOVA was performed.
Results. Statistical analysis showed no significant changes in SFCT after 30 minutes of reading within either contrast polarity condition. Furthermore, no significant difference was found between contrast polarities regarding the change in SFCT.
Conclusion. In this study, contrast polarity during reading had no significant effect on SFCT in young adults.
Introduction
The choroid is a highly vascularized layer of the eye and plays an important role in supplying the outer retinal layers with oxygen and nutrients. Changes in subfoveal choroidal thickness (SFCT) have been associated with the development and progression of myopia in several studies.1,2 In addition, the choroid can respond dynamically to visual stimuli, allowing short-term changes in SFCT to occur.3 Such changes in SFCT can be measured non-invasively using optical coherence tomography (OCT).4,5
A particular focus of current research is the relationship between near work and the development of myopia. Intensive near work is considered a possible risk factor for the onset and progression of myopia.6,7,8 Several mechanisms have been discussed as possible explanations, including changes in accommodation and short-term structural adaptations within the choroid.9,8,10 It has been shown that SFCT can change over short time intervals, for example in response to different visual stimuli.3 These choroidal changes may therefore be related to processes involved in the development of myopia.1,2
In addition to the duration and intensity of near work, visual characteristics of the reading material may also influence ocular responses. These include brightness, contrast and text display. Different contrast polarities activate different neural pathways in the retina.11,12,13 Black text on a white background primarily stimulates the OFF pathway, whereas inverted contrast polarity – white text on a black background – preferentially activates the ON pathway.11,12,13,14 Since the choroid is functionally closely connected to the retina, different activation patterns of these pathways may also induce changes in the choroid. An experimental animal study suggests that retinal signals can be transmitted to the choroid through neural and biochemical mechanisms, including dopaminergic pathways and interactions with the retinal pigment epithelium.15 The choroid can respond to visual stimuli with changes in blood flow and tissue structure, which may be reflected in short-term changes in choroidal thickness.3 These pathways are not only involved in visual processing but are also associated with mechanisms regulating ocular growth. Previous studies have shown that increased stimulation of the OFF pathway may be associated with choroidal thinning, whereas stronger activation of the ON pathway is more likely to be associated with choroidal thickening.16,17,18 It therefore seems plausible that different contrast polarities during reading may lead to short-term changes in SFCT.
The present study investigated whether SFCT changes after 30 minutes of reading at a viewing distance of 40 cm. In addition, the study examined whether different contrast polarities during reading influence SFCT. Two contrast conditions were investigated: normal contrast polarity (black text on a white background) and inverted contrast polarity (white text on a black background).
Materials and Methods
All participants completed two reading conditions: one with normal contrast polarity and one with inverted contrast polarity. The order of the conditions was randomized, allowing intra-individual comparisons. Data collection took place between February and May 2025 at the Institute of Optometry, University of Applied Sciences and Arts Northwestern Switzerland (FHNW), Olten, Switzerland. The study was conducted in accordance with the Declaration of Helsinki and the guidelines of the University of Applied Sciences and Arts Northwestern Switzerland (FHNW). All participants provided written informed consent.
A total of 36 pre-presbyopic participants aged 18 to 30 years were included (mean age 23.58 ± 2.81 years). The refractive range was between +2.00 D and −5.00 D (mean −1.35 ± 1.41 D). Participants were required to have a visual acuity of at least 20/20 with habitual correction and an accommodative amplitude of at least five diopters. Individuals with myopia greater than −5.00 D, hyperopia greater than +3.00 D, astigmatism greater than 2.00 D, anisometropia ≥ 2.0 D, amblyopia, manifest or latent strabismus, diplopia, and known ocular pathologies were excluded. Participants with anisometropia were excluded to minimize possible effects of refractive differences between the two eyes and associated changes in binocular vision and accommodation on the measurement of choroidal thickness.
Following an initial pilot phase with four participants, an a priori power analysis was performed using G*Power (version 3.1.9.7) prior to the main data collection. Based on a paired t-test for two dependent samples, with a significance level of α = 0.05, a desired power of 1 −β= 0.90, and an assumed medium effect size (dz = 0.5), the required sample size was calculated as N = 36. As no directly comparable effect sizes were available for this specific study design, a medium effect size was assumed. The study was therefore primarily designed to detect potentially relevant changes in SFCT.
SFCT was measured using a spectral-domain optical coherence tomography system (Spectralis OCT, Heidelberg Engineering, Heidelberg, Germany). Images were obtained using the enhanced depth imaging (EDI) mode. SFCT was measured manually from the outer border of the retinal pigment epithelium to the inner boundary of the sclera in the subfoveal region (Figure 1). The motor dominant eye was measured in each participant and was determined beforehand using the Hole-in-the-Card test (Miles test). Reading was performed under natural binocular viewing conditions.
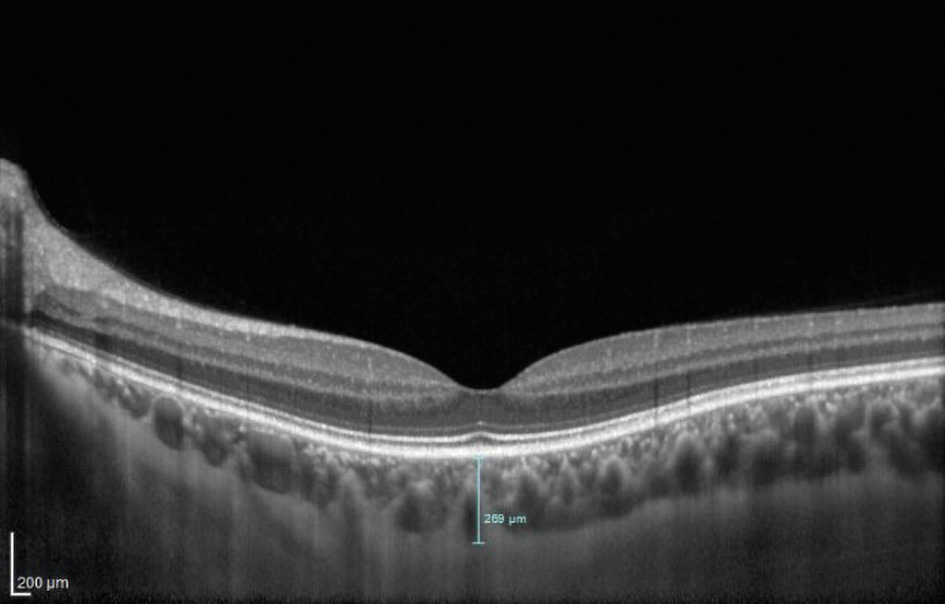
All participants completed a standardized examination procedure with defined intervals between the measurement phases. OCT measurements were performed between 10:30 a.m. and 7:30 p.m. with no particular time of day being specified for individual participants.
Data collection consisted of three predefined measurement phases. In phase 1 (P1), a baseline SFCT measurement was obtained after participants fixated a distant target to relax accommodation. This was followed by a 30-minute reading phase at a viewing distance of 40 cm under constant illumination of 710 lux. The reading phases took place in a separate reading room which allowed participants to complete the reading tasks in a distraction-free environment. Participants were instructed to maintain a constant reading distance of 40 cm throughout the reading phase, the distance was monitored by the researcher. The text was presented on a laptop display with a resolution of 1920 × 1080 pixels under standardized conditions (Arial font, font size 11, plain text without images). The screen scaling was set to 100 %. The same device was used for both contrast polarities at maximum screen brightness. The text was presented either in normal contrast polarity (black text on a white background) or inverted contrast polarity (white text on a black background). The reading text was presented only during the reading phase. OCT measurements were performed immediately after each reading phase in a separate, darkened examination room. Immediately after this reading period, phase 2 (P2) measurements were obtained.
After a 10-minute neutralization period with distance fixation, a second 30-minute reading phase was conducted using the same text in the opposite contrast polarity. Subsequently, phase 3 (P3) measurements were obtained. The order of contrast polarities (Group A or Group B) was determined by random group allocation using card drawing, and participants were assigned accordingly to either Group A or Group B. This crossover design allowed for participants to complete both contrast polarity conditions in different sequences, allowing potential order effects to be controlled through intra-individual comparisons. Due to random allocation, the group sizes were unequal (Group A: n = 23; Group B: n = 13). Group A first read a text in normal contrast polarity and subsequently the same text in inverted contrast polarity, whereas Group B completed the same conditions in the opposite order.
The examiner performing the OCT imaging and manual segmentation was masked to the contrast polarity condition. Manual segmentation and measurement of SFCT were performed by the same examiner using the integrated measurement tool of the Heidelberg software. SFCT was measured three times in each phase on the same image, and the mean value was calculated to improve measurement reproducibility. Manual segmentation was performed in the subfoveal region between the retinal pigment epithelium and the choroid-sclera interface. To assess intraobserver reliability, the intraclass correlation coefficient (ICC) was calculated.
Statistical analyses were performed using Microsoft Excel, G*Power, and Jamovi (version 2.6.44). Normality of the data was assessed using the Shapiro–Wilk test. For normally distributed data, paired t-tests were applied; otherwise non-parametric tests (Wilcoxon signed-rank test) were used. The significance level was set at α = 0.05. In addition, a repeated-measures analysis of variance (repeated-measures ANOVA) was performed to analyze intraindividual changes across the measurement phases.
Results
Data from all 36 participants were included in the statistical analyses. Participants were assigned to two groups according to the sequence of contrast polarities. GroupA (n =23) started with normal contrast polarity and subsequently read the same text in inverted contrast polarity, whereas Group B (n = 13) completed the conditions in the opposite order. The group allocation served solely to control for potential order effects and was not interpreted as an independent group comparison.
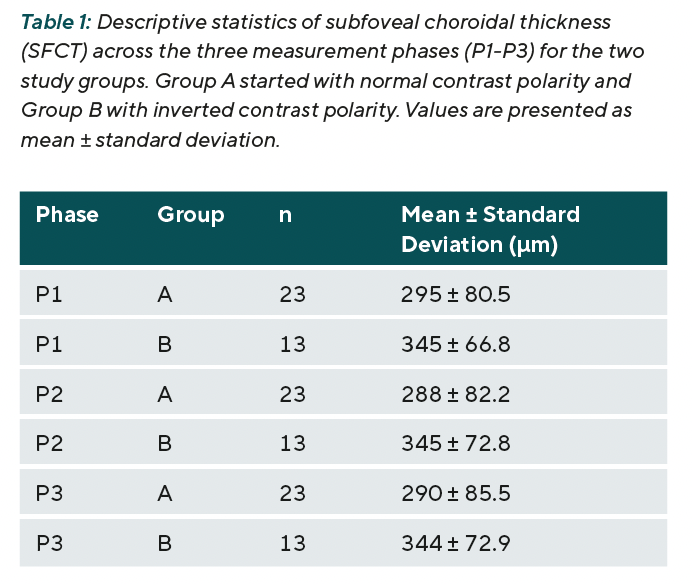
Descriptive statistics of SFCT across the three measurement phases are presented in Table 1. Mean SFCT values remained largely stable across the three measurement phases. Intraobserver reliability for manual SFCT measurements was excellent (ICC = 0.998; 95% CI: 0.997-0.998). The distribution of the measured SFCT values across the three phases is shown in Figure 2. Group B showed descriptively higher absolute SFCT values than Group A. However, as group allocation reflected only the order of contrast polarity conditions, only intra-individual changes in SFCT were considered in the primary analysis.
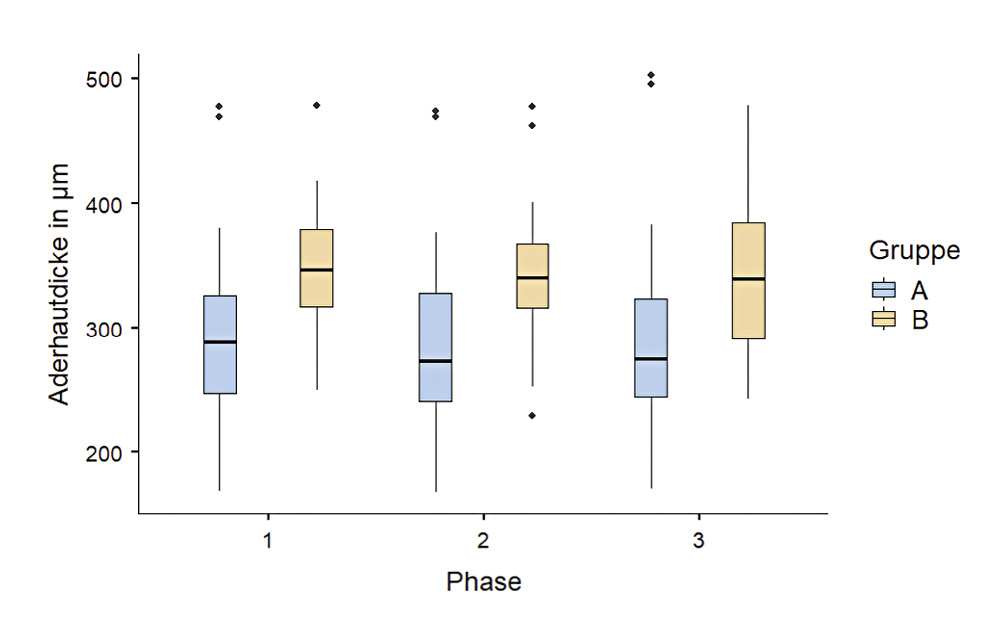
Changes in SFCT across the three measurement phases were analyzed using a repeated-measures analysis of variance (ANOVA). No significant main effect of measurement phase on SFCT was observed (F(1.57, 53.37) = 0.03, p = 0.944, η2p = 0.001). Likewise, the interaction between measurement phase and contrast polarity was not statistically significant (F(1.57, 53.37) = 0.13, p = 0.828, η2p = 0.004).
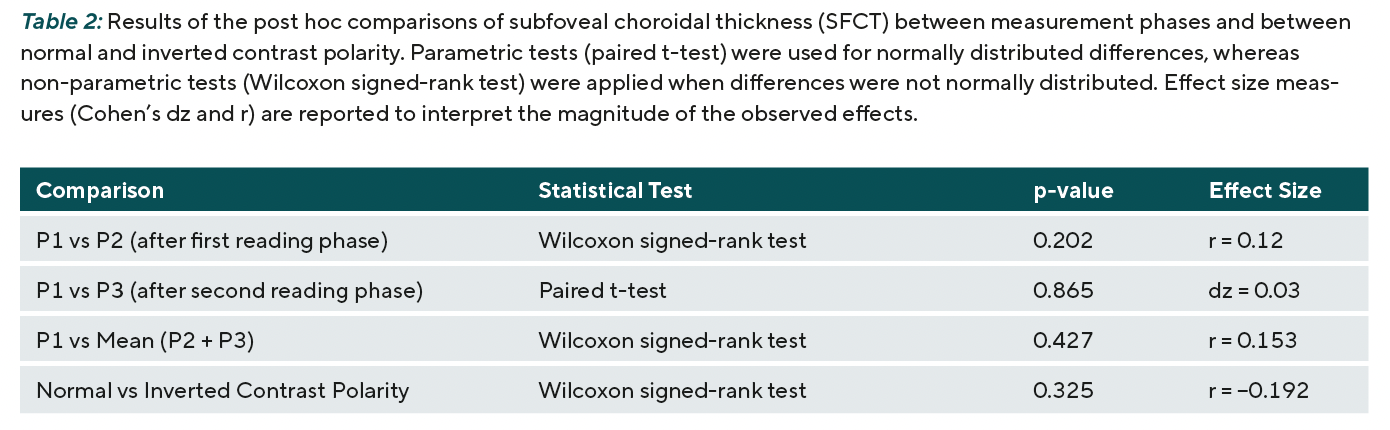
Additional post hoc comparisons, performed using parametric or non-parametric methods depending on data distribution, revealed no statistically significant differences in SFCT between baseline (P1) and the first post-reading measurement (P2) (p = 0.202). The results of the statistical comparisons are summarized in Table 2. Similarly, no significant difference was found between P1 and P3 (p = 0.865). A combined comparison of both reading phases with baseline also confirmed the absence of statistically significant changes in SFCT (p = 0.427).
Effect sizes for all comparisons were consistently small, indicating a lack of clinically relevant differences. Because both parametric and non-parametric statistical methods were applied, different effect size measures were reported (Cohen’s dz and r), which are not directly comparable.
No significant effect of contrast polarity on SFCT was observed. The change in SFCT following reading under normal contrast polarity did not differ significantly from the change observed after reading with inverted contrast polarity (p = 0.325). This finding was independent of the order in which the contrast polarity conditions were presented.
Discussion
The present study investigated the influence of near work under two different contrast polarities on short-term changes in SFCT. Neither reading itself nor the switch between normal and inverted contrast polarity resulted in statistically significant changes in SFCT. Previous studies have shown that the choroid can respond rapidly to visual stimuli and accommodative demand, indicating that SFCT is capable of short-term adaptation.3,16,17,18,19
The absence of significant effects may be interpreted in different ways. It is possible that short-term choroidal changes under the selected conditions were small or absent. Alternatively, methodological factors may have limited the sensitivity to detect subtle effects.
These findings contrast with three experimental studies that reported contrast polarity-dependent choroidal responses.16,17,18 Previous studies described choroidal thinning following stimulation of the OFF pathway by black text on a bright background and choroidal thickening following stimulation of the ON pathway under inverted contrast polarity.16,17 The inability to replicate these findings in the present study suggests that such responses may depend strongly on the specific experimental conditions.
One possible explanation for the discrepant findings may lie in the design of the visual stimulation. Previous studies reporting measurable changes in choroidal thickness partly used longer stimulation periods of 40-60 minutes,20,21 higher accommodative demand 22 or OCT measurements performed during sustained accommodation.19 In the present study, each reading phase lasted 30 minutes at a viewing distance of 40 cm. Furthermore, OCT measurements were performed immediately after completion of the reading phase. As a result, possible short-term effects may have been smaller in magnitude or may already have partially subsided before measurement.
Another factor to consider is the age of the study population. The sample consisted of young adults with stable refractive development. In this age group, ocular growth is largely complete, and adaptive choroidal changes may therefore be less pronounced than in children or adolescents. This may explain why studies investigating myopia progression in younger populations more frequently report stronger choroidal responses.3,23
The variability of SFCT over time should also be considered. Although the statistical analyses focused on intra-individual changes, fluctuations between repeated measurements may reduce the ability to detect small effects. Repeated measurements within each phase and calculation of mean values were intended to reduce random measurement error. Additionally, the excellent intraobserver reliability supports the reproducibility of the manual segmentation procedure.
Methodological factors may also have influenced the findings. OCT-based assessment of SFCT requires precise identification of the choroid-sclera interface, which can be challenging in some cases.4,5 The use of enhanced depth imaging and repeated measurements in each phase was intended to improve measurement accuracy. Nevertheless, a certain degree of measurement uncertainty cannot be completely excluded. Visual stimulation was performed under standardized conditions using continuous reading on a digital display at a fixed reading distance of 40 cm and predefined contrast polarity. This setup largely corresponds to the procedures used in comparable studies and allows controlled comparisons between conditions. However, it only partially reflects natural reading situations, which are typically characterized by changing viewing distances, interruptions, and varying lighting conditions.
Diurnal variation in choroidal thickness represents another potential influencing factor. Previous studies have shown that choroidal thickness can vary by up to 40 µm throughout the day.24,25 A substantial influence on the intra-individual changes observed in the present study is unlikely, as all measurement phases for each participant were completed during a single session on the same day. However, as measurements were not performed at a standardized time of day, partly due to organizational constraints, some of the variability between participants may be associated with differences in the timing of data collection.
A strength of the present study is the controlled crossover design with intra-individual comparisons, as all participants completed both contrast polarities. In addition, measurements were performed under standardized conditions with a fixed reading distance and controlled illumination. Nevertheless, several limitations should be acknowledged. The sample size was determined by an a priori power analysis to detect medium-sized effects; therefore, smaller but potentially physiologically relevant effects may not have been detectable. Furthermore, the restriction to young adults limits the generalizability of the findings to other age groups. Confidence intervals were not reported consistently throughout the analyses, which may additionally limit the assessment of the precision of the estimated effects.
Despite these limitations, the findings suggest that contrast polarity-dependent choroidal responses may be more subtle than previously assumed and may depend strongly on the specific experimental conditions. This may contribute to a better understanding of myopia-associated processes.
Future studies should therefore investigate different exposure durations in combination with varying accommodative demands and systematically compare measurements obtained during visual stimulation with those obtained immediately afterward. Larger sample sizes and younger study populations should also be considered. Additionally, future studies could include further biometric parameters such as axial length or changes in choroidal blood flow to improve understanding of the relationship between visual stimuli and structural adaptations of the eye.
Conclusion
The results of this study show that, under the investigated conditions, neither a 30-minute reading period nor a change between normal and inverted contrast polarity resulted in significant short-term changes in SFCT. The findings suggest that contrast polarity-dependent choroidal responses may depend more strongly on specific experimental conditions, exposure duration, accommodative demand or the age group studied.
Based on the present results, no direct clinical recommendations for myopia management regarding the use of different reading contrast conditions can be derived. Further studies with larger sample sizes and expanded measurement approaches are needed to better understand the role of contrast polarity in the regulation of ocular growth.
Acknowledgements
We would like to thank our project coach for her professional guidance and valuable suggestions throughout the planning and conduct of this study. We also thank the Institute of Optometry at the University of Applied Sciences and Arts Northwestern Switzerland (FHNW), Olten, for providing the facilities and equipment that made this study possible. Finally, we thank all participants for their willingness to take part in this study.
Conflict of Interest
The authors declare that they have no conflict of interest related to the methods and devices mentioned in this article.