Genetic prediction of myopia in different ethnic ancestries
Background: Myopia has been shown to have a complex mode of inheritance, being influenced by both genetic and environmental factors. Here, an introduction into myopia genetics is given, with the shortcomings of current genetic prediction for myopia discussed, including the proportionally limited research on genetic prediction in people of non-European ancestry. A previously developed genetic risk score derived from European participants was evaluated in participants of non-European ancestry.
Methods: Participants from UK Biobank who self-reported their ethnicity as “Asian”, “Chinese”, or “Black” and who had refractive error and genetic data available were included in the analysis. Ancestral homogeneity was confirmed using principal component analysis, resulting in samples of 3500 Asian, 444 Chinese, and 3132 Black participants. A published refractive error GWAS meta-analysis of 711,984 participants of European ancestry was used to create a weighted genetic risk score model which was then applied to participants from each ethnic group. Accuracy of genetic prediction of refractive error was estimated as the proportion of variance explained (PVE). Receiver operating characteristic (ROC) curves were developed to estimate myopia prediction performance at three thresholds: any myopia (equal to or more than 0.75D), moderate myopia (between -3.00D and -4.99D) and high myopia (equal to or more than -5.00D). Odds ratios for myopia were calculated for the participants in the top 10th or 5th percentile of genetic risk score distribution, comparing them to the remainder of the population.
Results: The PVE value for refractive error was 6.4%, 6.2%, and 1.5% for those with Asian, Chinese and Black ethnicity, respectively (compared to 11.2% in Europeans). Odds ratios for any myopia and moderate myopia development for those within the top 10th and 5th percentile of genetic risk were significant in all ethnic groups (P<0.05). However, the genetic risk score was not able to reliably identify those at risk of high myopia, other than for participants of Chinese ethnicity (P<0.05).
Conclusion: Prediction of refractive error in Asian, Chinese and Black participants was ~57%, 55% and 13% as accurate in comparison to prediction in European participants. Further research in diverse ethnic populations is needed to improve prediction accuracy.
The current understanding of myopia and its complex trait inheritance
Myopia is a type of refractive error, where the refractive components of the eye cause light to focus in front of the retina, resulting in a blurry image for objects at distance. The prevalence of myopia has increased across the world, with an estimated 50% of the population predicted to be myopic by 2050.1 Within the UK and Europe, there is much evidence pointing towards an increase in the prevalence of refractive error, with those from younger generations having a higher prevalence of myopia, and greater amount of myopic refraction.2,3
The increase in myopia is greatly relevant to healthcare providers and eye care professionals. Not only does myopia cause a lifelong4 requirement of constant vision correction, causing a financial burden to those with myopia,4 but it is associated with a greater increased risk of several sight-threatening diseases in adulthood.5 This includes myopic maculopathy and retinal detachment, where even those with low amounts of myopia can still carry an additional risk compared to non-myopic individuals.5,6 This is predominantly due to the axial elongation that occurs in most myopia development, which means that the vitreous chamber of the eye grows longer. Because of this, the risk of associated complications increases with greater amounts of myopia and axial elongation.7
Myopia can be developed due to solely environmental factors, for example in unilateral congenital ptosis, where eyes are form-deprived and lead to myopia.8,9 In cases of syndromic myopia, genetic influence is typically the strongest determinant factor.10,11 However, in the majority of cases the end result of refractive error present is influenced by a combination of environmental factors and genetic predisposition.12
The genetic organisation of myopia
Studies looking for associations for a trait across the entire genome are known as Genome Wide Association Studies (GWAS). These studies look at locations where common genetic variants are present throughout homogenous populations, and assess the association between their presence and having the trait of interest. This has been useful in studies looking at refractive error and myopia, as the genetic framework for refractive error and myopia in the general population has been shown to be highly polygenic.12 This means that there are numerous different genetic variants (known as polymorphisms) across the whole genome that all contribute a small effect on the trait. These are generally presumed to work in an additive pattern, where all the polymorphism effects (known as their weights) for each variant can be added together to obtain the total estimate of the outcome expected genetically.
GWAS studies can look at phenotypes (observed traits) on a scale (e.g. height or refractive error) or categorical format of having a specific trait (e.g. having myopia above a threshold level: yes or no). As genetic studies have begun to use greater numbers of people, more and more polymorphic sites in the genome have been shown to be associated with refractive error. One meta-analysis of over 500,000 people has demonstrated that over 438 discrete locations within the human genome were significantly associated with refractive error.13
The GWAS output data, known as summary statistics, can then be used in several applications. One of the popular applications related to human health is in predicting the likelihood of someone developing a disease from their genetic profile.14 Genetic prediction in this manner can be used to estimate the end results of a trait and whether the person is at a significantly greater chance of having it, stratifying people within a population into different levels of risk for a given disease.
Current understanding of genetic prediction for myopia
There are several potential uses for assessing the genetic risk of children for myopia which have been discussed before.15 This includes the incorporation of personalised medicine, where children who may be most likely to benefit from an intervention, or benefit from a particular type of intervention can be identified from their genetics. It also includes their use in identifying children before the development of myopia for prophylactic intervention, and identification of children that are likely to develop greater levels of myopia. Regarding the potential for personalised medicine, one study has shown that differences in response to optical intervention for myopia for those with certain genetic variants is plausible, but that further studies and larger samples are still needed to confirm the pilot data.16 Therefore, although this is a promising consideration, the evidence for the use of genetic data in this manner is not conclusive. Considering prophylactic intervention, other than possibly increased time outdoors17 there is no current intervention directly tested in those with pre-myopia or increased risk within western countries. Therefore, the use of genetic prediction for children likely to develop myopia remains a plausible prospect, but until the concept of prophylactic treatment is validated through optical interventions, this can only remain a hypothesis.
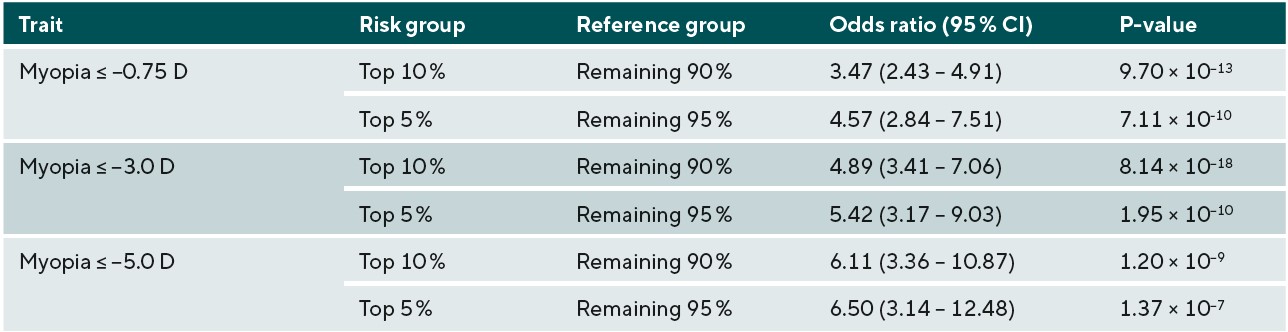
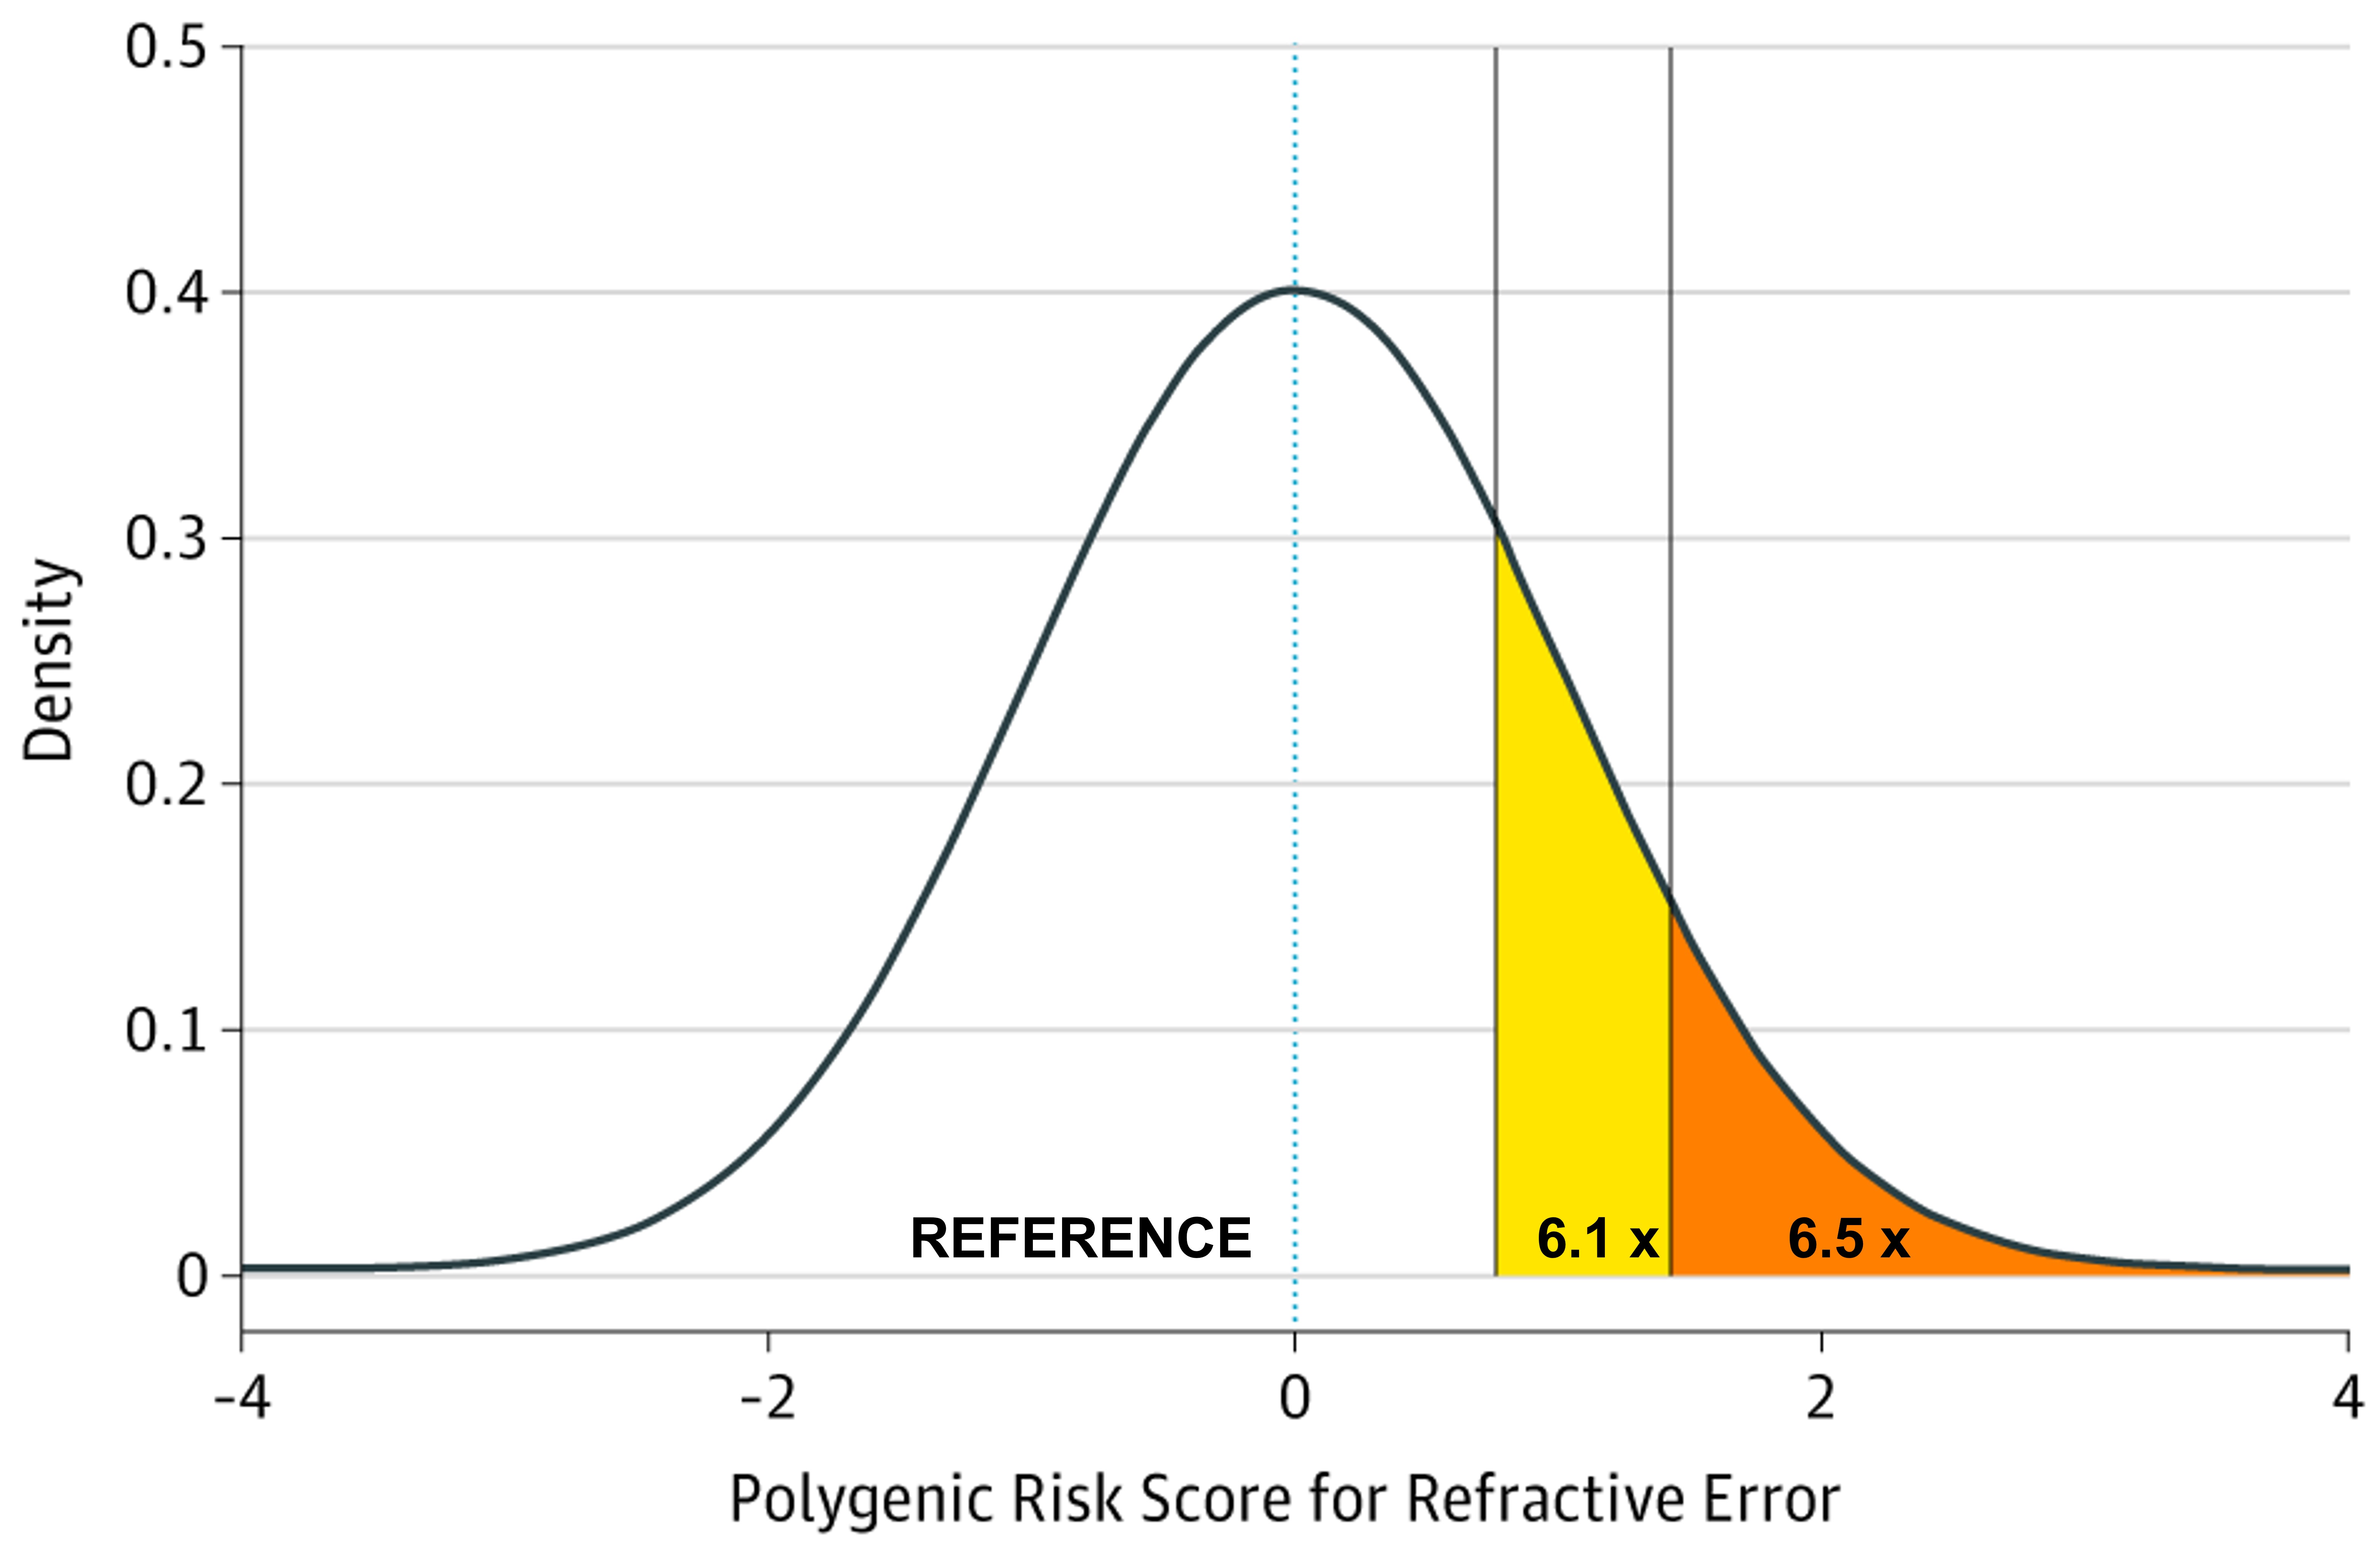
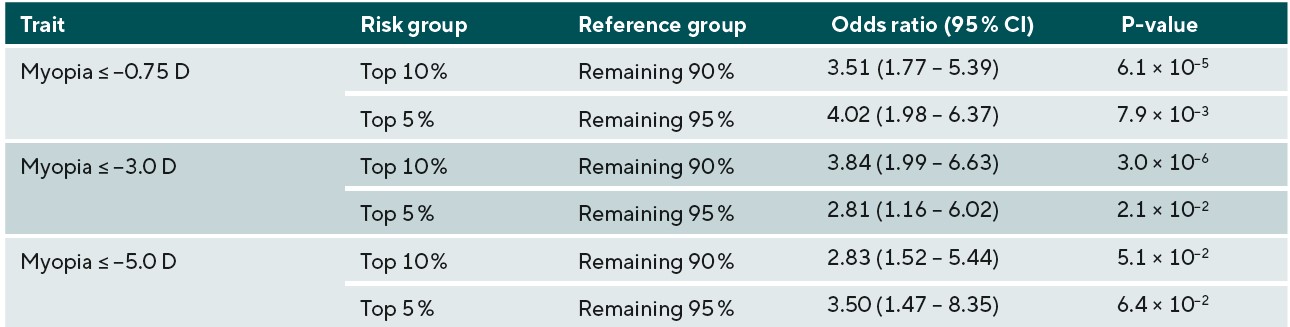
The potential identification of children likely to go on to develop higher levels of myopia in adulthood, and subsequently develop associated complications has been investigated, with discernible ability to measure the genetic risk of those likely to develop myopia. A study using GWAS summary statistic data from over 700,000 people stratified those within the top 10th and 5th percentiles of genetic risk for myopia development and demonstrated that those groups had an increased odds of 6.11 and 6.50 for developing high myopia (equal to or greater than -5.00D) in comparison to the remaining 90% and 95% of the population respectively, as shown in Figure 1 and Table 1.18 In principle this would imply that high-risk children who were identified to be within the top 10% of predisposing risk for myopia would benefit from closer observation and frequent sight tests to monitor for the onset of myopia. Moreover, risk-benefit analyses may suggest that earlier or prophylactic intervention with myopia management may be recommended for these individuals, as their estimated risk of high myopia and potential associated pathology in adulthood is demonstrably higher, and this may outweigh the additional costs and risks of current available interventions such as myopia management spectacles and contact lenses.
Limitations of current genetic prediction of myopia
Despite demonstrating risk stratification through genetic risk models, there are some limitations to our current genetic prediction ability for myopia. Although the ability to differentiate relative risk of myopia development can be seen, this is not as accurate as using cycloplegic refraction in children when they’re at an age where myopia development usually occurs (typically 6-12 years old).19,20 Receiver operating characteristic curves for predicting myopia from the same genetic risk model discussed previously for any myopia (equal to or greater than-0.75D), moderate myopia (between -3.00D and -4.99D), and high myopia (equal to or greater than-5.00D) demonstrated an area under the receiver-operating characteristic curve (AUROC) of 0.67, 0.75, and 0.73, respectively,18 which was significantly greater than by chance, i.e. 50%, implying that the accuracy was beginning to reach a point where clinical utility would be of use. For using refraction thresholds for young children in the CLEERE study, the AUROC was 0.87.19 However, genetic prediction would have the benefit of predicting children’s risk at birth, meaning that before the development of a high-risk refraction, children at greater risk could be monitored more carefully, and given lifestyle advice.15 Should a prophylactic intervention be developed, genetic testing would be able to select children that would likely benefit most.
Another limitation of the aforementioned genetic risk score model is that it has been created and tested within a population of people with European ancestry only. This is because GWAS analyses require large sample sizes of homogenous participants, and large-scale genetic studies have rarely been performed outside of Europe and the United States. This disproportionate study of those with European ancestry has been widely acknowledged within the field,21 and combining participants from multiple ancestries in a genetic analysis is not advised because of the potential confounding bias that can occur. This is because populations with differing genetic ancestries show widespread differences in genetic variant allele frequencies.22 When there is an increased prevalence of the phenotypic trait in one ancestry group, such as myopia - where prevalence rates vary from samples in Europe compared to those in Asia - then this would lead to spurious genetic associations. As the genetic risk score model mentioned above has only been tested in those with European ancestry, in this study, the accuracy of the genetic risk score model was tested in participants of Asian, Chinese and Black ethnicity, to determine whether it would be feasible to use in identifying those at greater risk of developing myopia.
Methods
Study Populations
The primary sample data for this study was taken from individuals with non-European ancestry from the UK Biobank study who had both genetic data and data on their refractive error status. Specifically, participants who self-reported as “Asian”, “Chinese”, or “Black” ethnicity (categorised from the UK Census) were taken forward for analysis. The samples with Asian and Chinese ethnicity were kept separate in the analysis, as the majority of the Asian ethnicity sample had South Asian ancestry while the majority of the Chinese ethnicity sample had East Asian ancestry and because the prevalence of myopia differs between these regions.1
UK Biobank is a large dataset of over 500,000 adults aged 40-70 years old registered within the UK, that underwent initial testing between 2006 to 2010.24 The UK Biobank project rationale was to collect data to allow for large-scale investigation into environmental and genetic factors for complex diseases which are becoming more common in UK adults. Those who consented to take part were then asked to undertake a battery of tests and assessments. Depending on the date of the appointment and the study site the participant attended, the participants could then also have clinical measurements taken, including non-cycloplegic autorefraction.25 This meant that although most participants had their genetic data analysed and completed the questionnaire, refraction data was not available for all of the cohort.
To select a genetically homogenous group of individuals from each ethnic group, principal component analysis-based classification was performed to determine ancestral homogeneity clustering within each ethnic category. This was done by using the mean and standard deviation of the first 10 principal components (reported by Bycroft et al.26) for each self-reported ethnic group. Participants not within ±10 standard deviations from the mean value for any of the first 10 principal components were excluded. This process identified groups of participants whose genetic background clustered with other participants from the same self-reported ethnic group, leading to a genetically homogenous sample. After this filtering process, there were 3500, 444, and 3132 participants who self-reported their ethnicity as Asian, Chinese, and Black, respectively.
To contextualise the accuracy of the genetic prediction results, prior results looking at the accuracy of genetic risk scores of refractive error and myopia in individuals with European ancestry were also included in results. Specifically, the validation sample results from Ghorbani Mojarrad et al. comprising of 1516 female adult participants of European ancestry from the Avon Longitudinal Study of Parents and Children (ALSPAC) was used for comparison.18 These data were selected as they had been analysed using the same genetic risk score model, allowing for direct comparison of the genetic risk score model in other ancestry groups.
Genetic Risk Score Modelling
The genetic risk score model was derived from a GWAS meta-analysis that included 711,984 participants of European ancestry. The meta-analysis used data from GWAS summary statistics for 3 traits: autorefraction-measured refractive error18, age of first spectacle wear18, and educational attainment27. Data were meta-analysed with the MTAG software package.28 The meta-analysed summary statistics were processed with the LDPred software package to create weighted genetic risk scores assuming an infinitesimal model.29 This signifies that all genetic variants in the model are assigned a weighting factor using their GWAS estimated effect sizes and accounting for linkage disequilibrium between variants. A detailed description of the creation of this model has been published previously18 and is not repeated here.
The accuracy of genetic prediction for refractive error as a continuous trait was established using the coefficient of determination (R2 value) as an estimation of the proportion of variance explained (PVE) for refractive error. To estimate myopia prediction performance, the sensitivity and specificity of the genetic risk score was estimated by calculating the AUROC. Performance was evaluated for three levels of myopia: any myopia (equal to or more than-0.75D), moderate myopia (between -3.00D and -4.99D) and high myopia (equal to or more than -5.00D). Odds ratios for myopia development were calculated to determine the genetic risk score model’s ability to discriminate the risk of myopia development in participants of each ethnic group. Specifically, the odds of those in the top 10% and 5% of the genetic risk score distribution for myopia was compared to the odds in the remaining 90% or 95% of the genetic risk score distribution. This analysis was performed for each of the three different levels of myopia, to determine whether those at risk of higher myopia could be identified. Calculation of the R2 value, AUROC, and odds ratios along with visualisation where appropriate were performed using the R statistics software (version 3.3.4).
Results
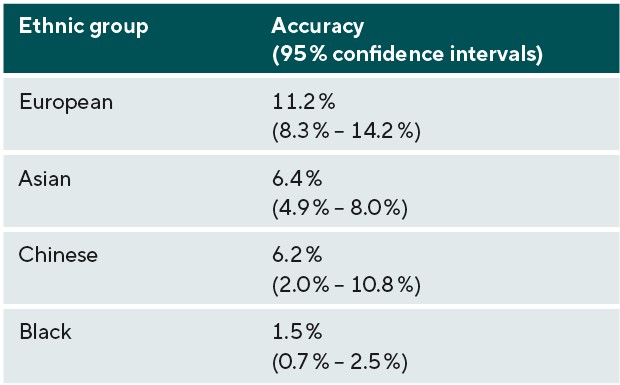
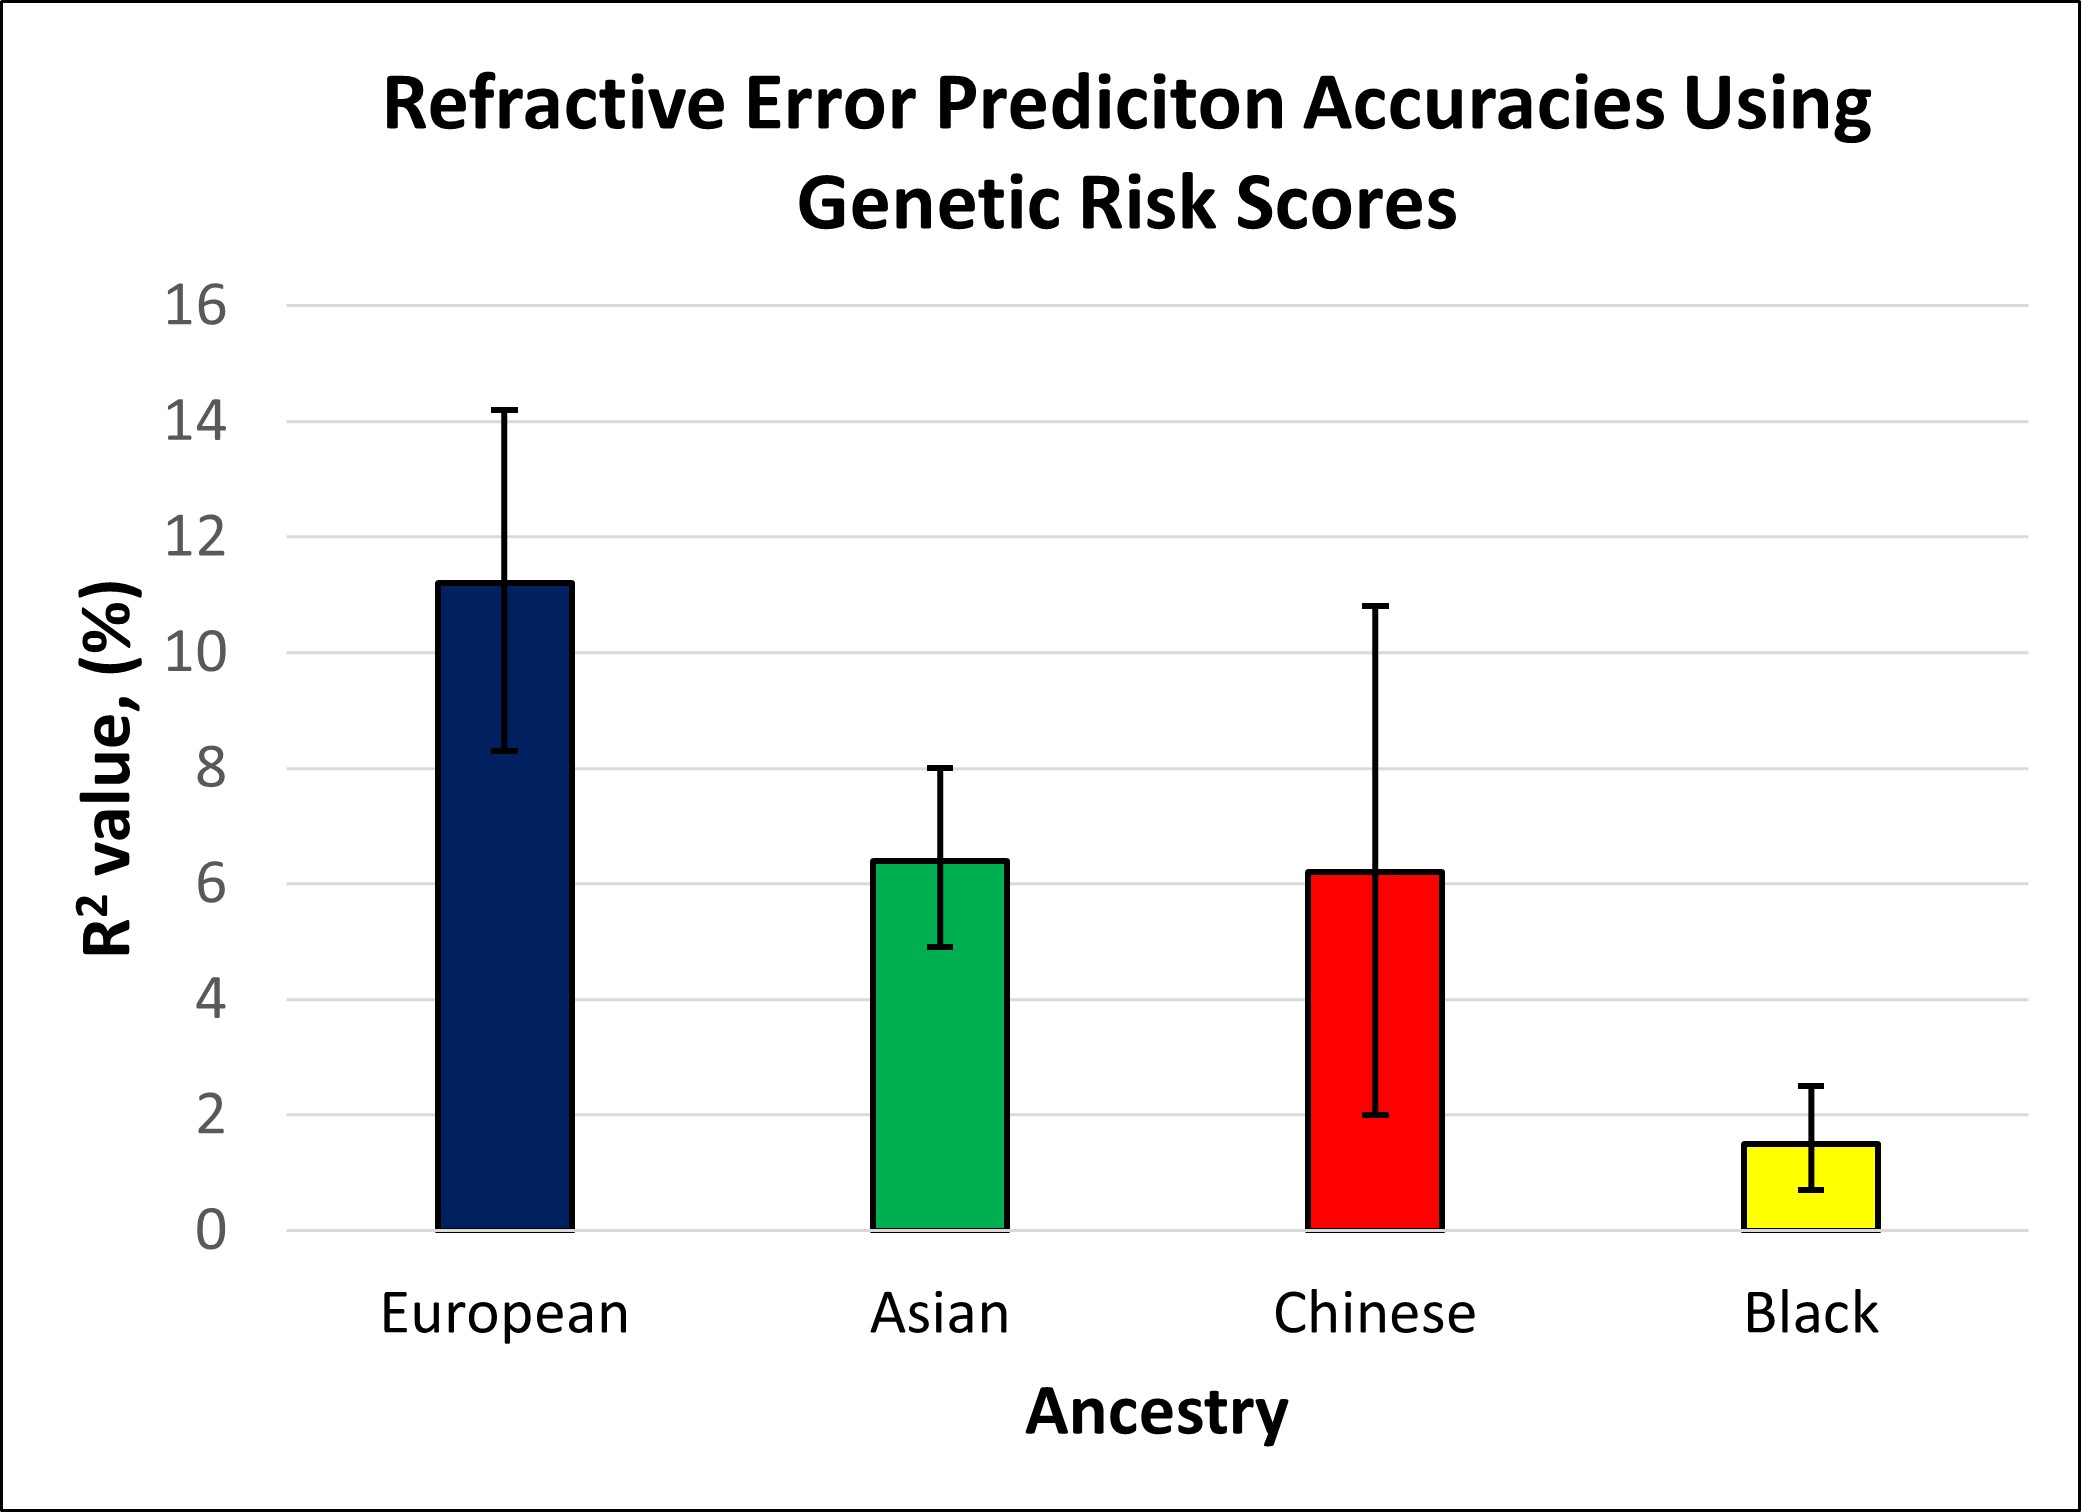
The prediction accuracy for refractive error in the different ethnic groups is displayed in Table 2 and Figure 2. Table 2 and Figure 2 also include the accuracy of the model in predicting refractive error in European participants for comparison. Accuracy was similar for participants of Asian and Chinese ethnicity (6.2 and 6.4%), whereas the accuracy of prediction in those of Black ethnicity was markedly lower at 1.5%. In comparison with the prediction accuracy in participants of European ancestry, genetic prediction in the Asian and Chinese samples had a relative accuracy of 57% and 55%, and in the Black sample the relative accuracy was only 13%. The result for the Chinese ethnicity sample had a much wider confidence interval, due to the smaller number of participants used within this validation sample.
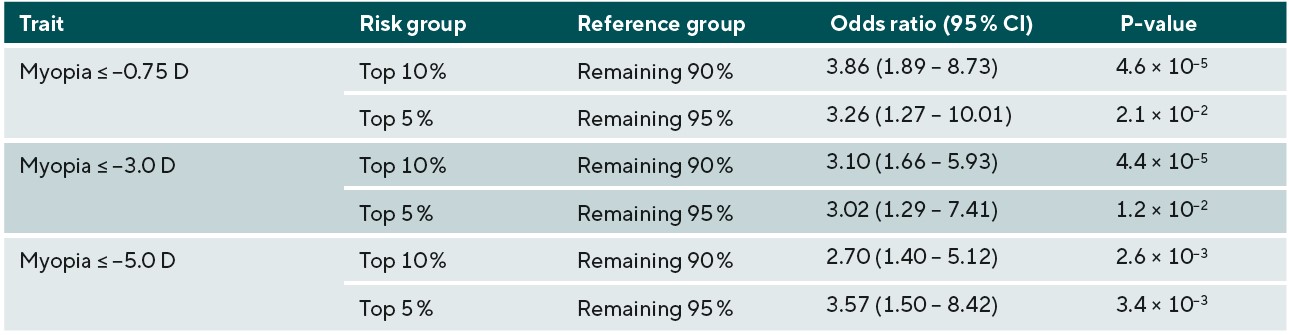
The accuracy of predicting the development of any myopia, moderate myopia, and high myopia for the different ethnic groups is demonstrated in Figure 3. Myopia prediction accuracy in the different ethnic groups followed a similar pattern to that of refractive error prediction accuracy, being moderate in those with Asian and Chinese ethnicity, and much lower accuracy in those who self-reported as Black. In the previously performed European ancestry analysis, accuracy was slightly higher for moderate myopia than any myopia or high myopia; this was also observed in the current study for Chinese participants. However, the pattern was different for participants with Asian or Black ethnicity; here, a small improvement in accuracy was found for predicting those at risk of high myopia (≤-5.00D). To determine whether the genetic risk model was useful in identifying individuals with an increased risk of myopia development, odds ratios for myopia development were calculated for those in the top 10th or top 5th percentile of the genetic risk score distribution, compared to the remaining 90% or 95% of the sample. The odds ratio values for those with Asian, Chinese, and Black ethnicity are listed in Table 3, 4, and 5, respectively.
Discussion
This study aimed to investigate whether a genetic risk score derived in individuals of European ancestry would have utility in identifying non-European individuals at high risk of becoming myopic. A previous study demonstrated that this genetic risk score achieved relatively good accuracy (R2 = 11.2% for refractive error; AUROC = 0.75 for moderate myopia risk) in predicting refractive error and moderate-to-high myopia in those of European ancestry. Here, the results demonstrated that the same genetic risk score did not perform as well when applied to other ethnicities. Accuracy varied depending on how distantly related the ethnic group in question was to Europeans. Privé et al. explored this when they investigated the portability of risk scores derived in UK Biobank European ancestry participants for 245 other phenotypes into nine other ancestry groups.30 They used participants from other ancestry groups within UK Biobank, similarly to this study, to reduce any potential bias from data collection and genotyping differences. They reported that for all of their phenotypes, the prediction utility drops in proportion to genetic distance, but to different extents. Interestingly, they also found that the accuracy of risk scores derived from the UK participants demonstrated reduction in samples of other European ancestry groups, implying that significant accuracy reduction occurs even in cases of comparatively minor differences in genetic variation.
The myopia genetic risk score in this analysis demonstrated a moderate predictive performance for those with Asian and Chinese ethnicity in comparison to those with European ancestry with a 44% loss in predictive accuracy (it should be noted, however, that our accuracy estimate in the Chinese sample was very imprecise, due to the much smaller sample size of participants of Chinese ethnicity). Interestingly, the current genetic risk score performed better than a recently reported genetic risk score that was tested in the Singapore Cohort of Risk factors for Myopia (SCORM) cohort.31 In the SCORM study, the performance of their genetic risk score for predicting myopia was also reduced in participants of Asian or Chinese ethnicity (R2 »4.1%), compared to those with European.31 It is likely that these findings are in part due to the SCORM study investigating children, who have not reached their final stable refractive error.
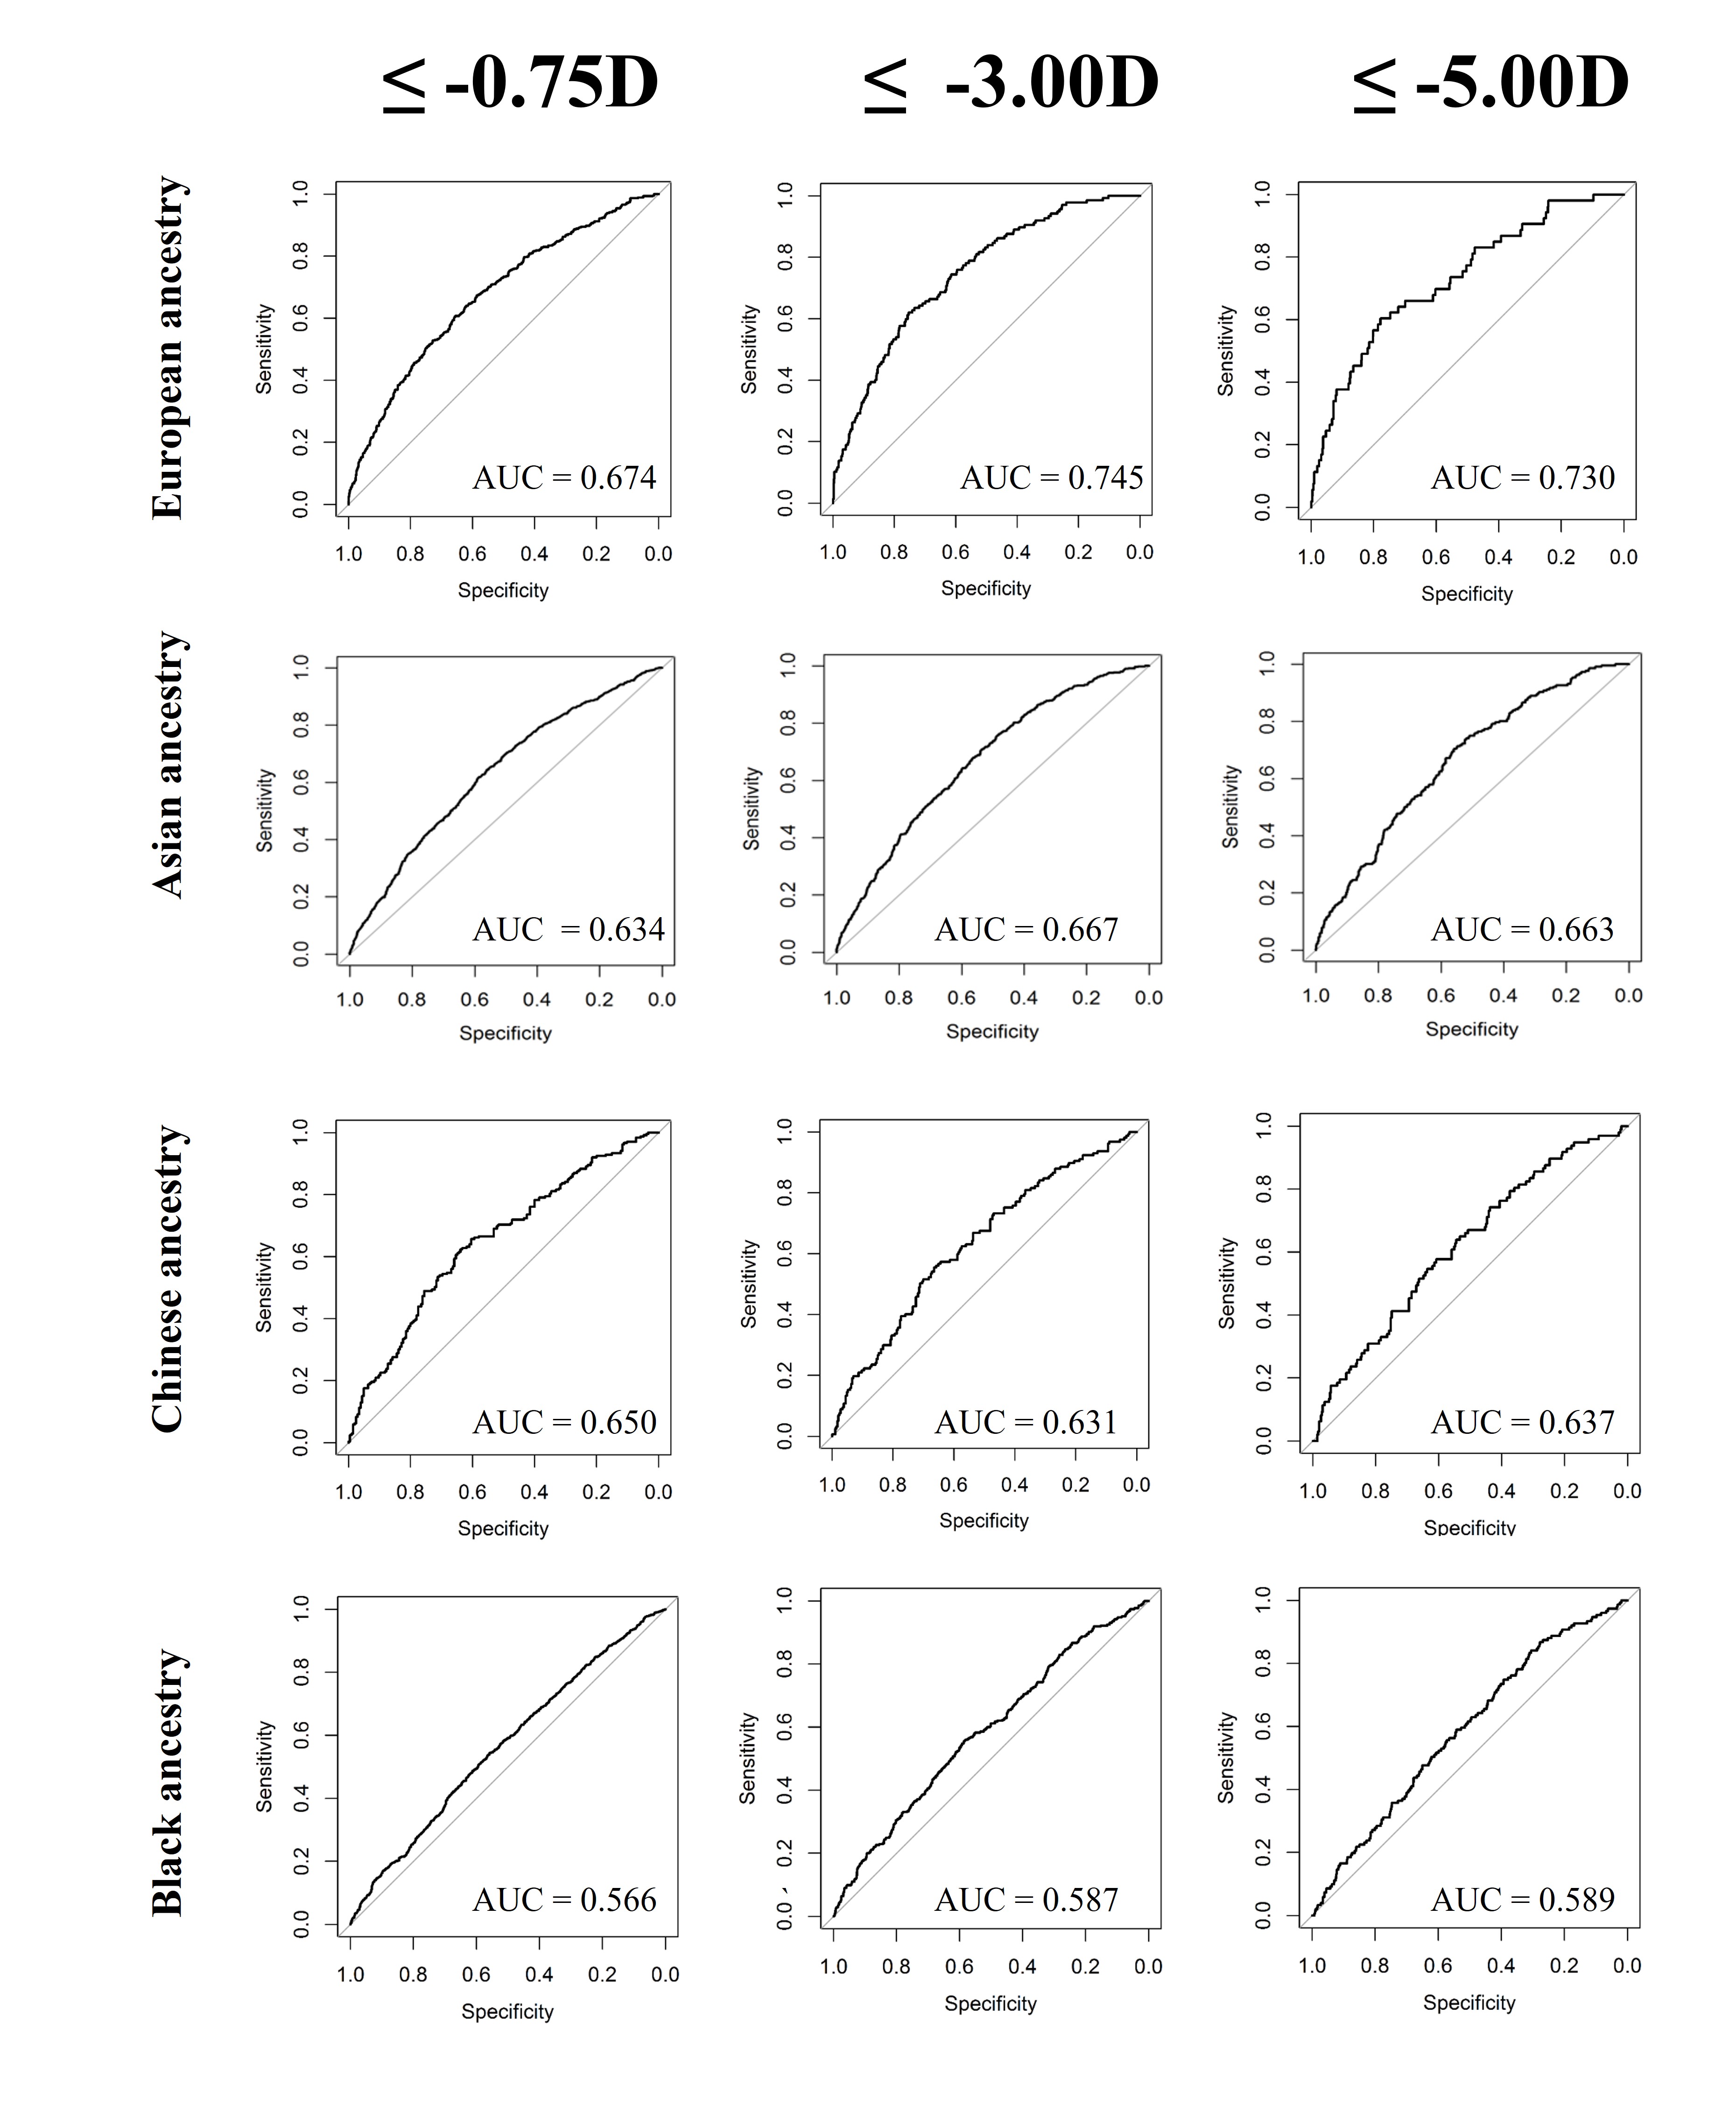
Results for the Black ethnicity group demonstrated the poorest accuracy for all prediction measures. The R2 value for predicting refractive error was only 1.5%, with lower bound confidence interval of 0.7%. The best AUROC value did not reach 0.60, indicating that the use of the genetic risk model was only marginally better than chance. Similarly to the Asian ethnicity sample, the AUROC for predicting any myopia and moderate myopia was better than chance level for those in the top 10th and 5th percentiles of the genetic risk score distribution compared to the remainder. However, this was not found for high myopia, where the model failed to identify those with greater risk. Given the overall reduced predictive accuracy, it is likely that the use of European ancestry derived genetic risk score models would be of limited benefit for identifying myopia in children with Black ancestry. This finding is similar to that of Duncan et al. who demonstrated that risk scores from European ancestry were least accurate when applied to individuals with African ancestry.32 Although this is likely to be partly due to genetic distance as in the Prive et al. study,30 it is likely also due to the greater genetic diversity of these individuals.
Furthermore, it is important to recognise that our AUROC values relate to the risk of predicting myopia in a group of individuals, and are hard to apply to predicting risk for a particular person. For example, Yang et al. demonstrated that when looking at the estimated trajectory of myopia progression for Asian children using the Brien Holden Vision Institute Myopia Calculator (BHVI calculator) and their actual progression, there are some significant discrepancies.33 When the cohort as a whole was included, the mean differences between the estimated BHVI calculated trajectory and actual refractive trajectory was less than 0.25D; but when looking at children in the sample at an individual level, the measured refraction of 64% of children was outside the 95% confidence intervals of the estimated refraction trajectory. Predicting the risk of myopia development for one specific person is much more challenging than detecting the averaged risk shared by a particular group, and therefore the derived risk of each person individually from such a genetic risk score should be interpreted with caution. With this in mind, when discussing with parents the likely risk of myopia in their children, these predictive models could be used as an educational tool to help communicate the issue of risk. Such discussions would also benefit from consideration of environmental risk factors, to establish a comprehensive risk profile, rather than focusing on genetic predisposition alone, which will never be able to provide a definite future diagnosis of myopia.

Overall, the results for the different non-European ethnic groups demonstrated that the current genetic risk score provided very limited utility in predicting myopia and high myopia. This implies that a risk-benefit analysis of using genetic prediction in children of non-European ancestries would be less favourable than in those of European ancestry. In other words, genetic prediction is not accurate enough to select individuals who have a very high risk of becoming highly myopic to warrant exposing them to a treatment that could have negative effects. However, for less invasive interventions with minimal risk, such as more time spent outdoors and more frequent sight testing, the risk-benefit equation may be more favourable. It is likely that, over time, as larger GWAS studies for myopia are performed in non-European ancestry groups, the accuracy for genetic prediction in non-European individuals will improve, and there may be a greater applicability for their use in clinical practice. Thus, this work emphasises the need for further large-scale myopia-related genetics research to be carried out in non-European populations.
Conflict of interest
The authors declare no competing or commercial interests. No financial disclosures.
Funding
Many parts of this project were performed during the time that author Neema Ghorbani Mojarrad was supported by the College of Optometrists with a Postgraduate Scholarship.
Acknowledgements
This research has been conducted using the UK Biobank Resource (applications #17351). UK Biobank was established by the Wellcome Trust; the UK Medical Research Council; the Department for Health (London, UK); Scottish Government (Edinburgh, UK); and the Northwest Regional Development Agency (Warrington, UK). It also received funding from the Welsh Assembly Government (Cardiff, UK); the British Heart Foundation; and Diabetes UK. Collection of eye and vision data was supported by The Department for Health through an award made by the NIHR to the Biomedical Research Centre at Moorfields Eye Hospital NHS Foundation Trust, and UCL Institute of Ophthalmology, London, United Kingdom (grant no. BRC2_009). Additional support was provided by The Special Trustees of Moorfields Eye Hospital, London, United Kingdom (grant no. ST 12 09).
Data analysis was carried out using the HAWK computing cluster, maintained by Supercomputing Wales and Cardiff University ARCCA.