Influence of astigmatism on stereopsis
Purpose: Astigmatism is one of the most common forms of refractive error and can affect visual acuity as well as
stereopsis. The aim of this study was to examine the influence of uncorrected symmetrical mixed astigmatism on binocular visual acuity and stereo threshold in different axis orientations.
Material and Methods: In a non-randomized cross-sectional study, 40 participants were examined in two age groups (18 - 30 years and over 50 years). Using trial lenses, symmetrical mixed astigmatism was simulated in three axis orientations (90°, 0°, 45°) and two magnitudes (0.5 D and 1.0 D). Binocular visual acuity was determined as an interpolated logMAR value, while the stereo threshold was measured using the Stereo Acuity Test D10. Data were analyzed using repeated-measures ANOVA and non-parametric tests.
Results: Binocular visual acuity significantly decreased with an increasing magnitude of simulated astigmatism (p < 0.001). Visual acuity was significantly worse at 1.0 D compared to 0.5 D. The stereo threshold also significantly increased with higher astigmatism (p < 0.01), indicating a decrease in stereopsis. The axis orientation of astigmatism had a significant effect on stereopsis: Against-the-rule and oblique astigmatism caused greater impairments than with-the-rule astigmatism. The effect of age was significant only for with-the-rule astigmatism at 1.0 D (p = 0.019), with older participants showing greater deterioration in stereopsis than younger ones.
Conclusion: Uncorrected mixed astigmatism leads to a significant decrease in binocular visual acuity and stereopsis, with the impact varying depending on axis orientation and astigmatism magnitude. The results suggest that even low levels of astigmatism should be corrected, particularly in individuals with limited accommodative ability.
Introduction
Astigmatism greater than 0.5 diopters affects approximately 40 % of the adult population worldwide. It is the most common form of refractive error.1
Depending on the magnitude of the astigmatism as well as the position and orientation of the image lines, a reduction in visual acuity is to be expected. The aim of this study was to investigate the extent to which uncorrected mixed astigmatism affects binocular visual acuity and stereopsis.
For this purpose, symmetrical mixed astigmatism was simulated using trial lenses in three different axis orientations. Binocular visual acuity and stereo threshold were measured. Four pairs of hypotheses were formulated for evaluation. The study examined whether visual acuity and stereo threshold differ with and without a simulated mixed astigmatism. In addition, the influence of the axis orientation of the simulated astigmatism on visual acuity and stereo threshold was analyzed. Furthermore, the study investigated, whether the age of the subjects has an influence on the stereo threshold in the presence of a simulated mixed astigmatism.
Basic principles
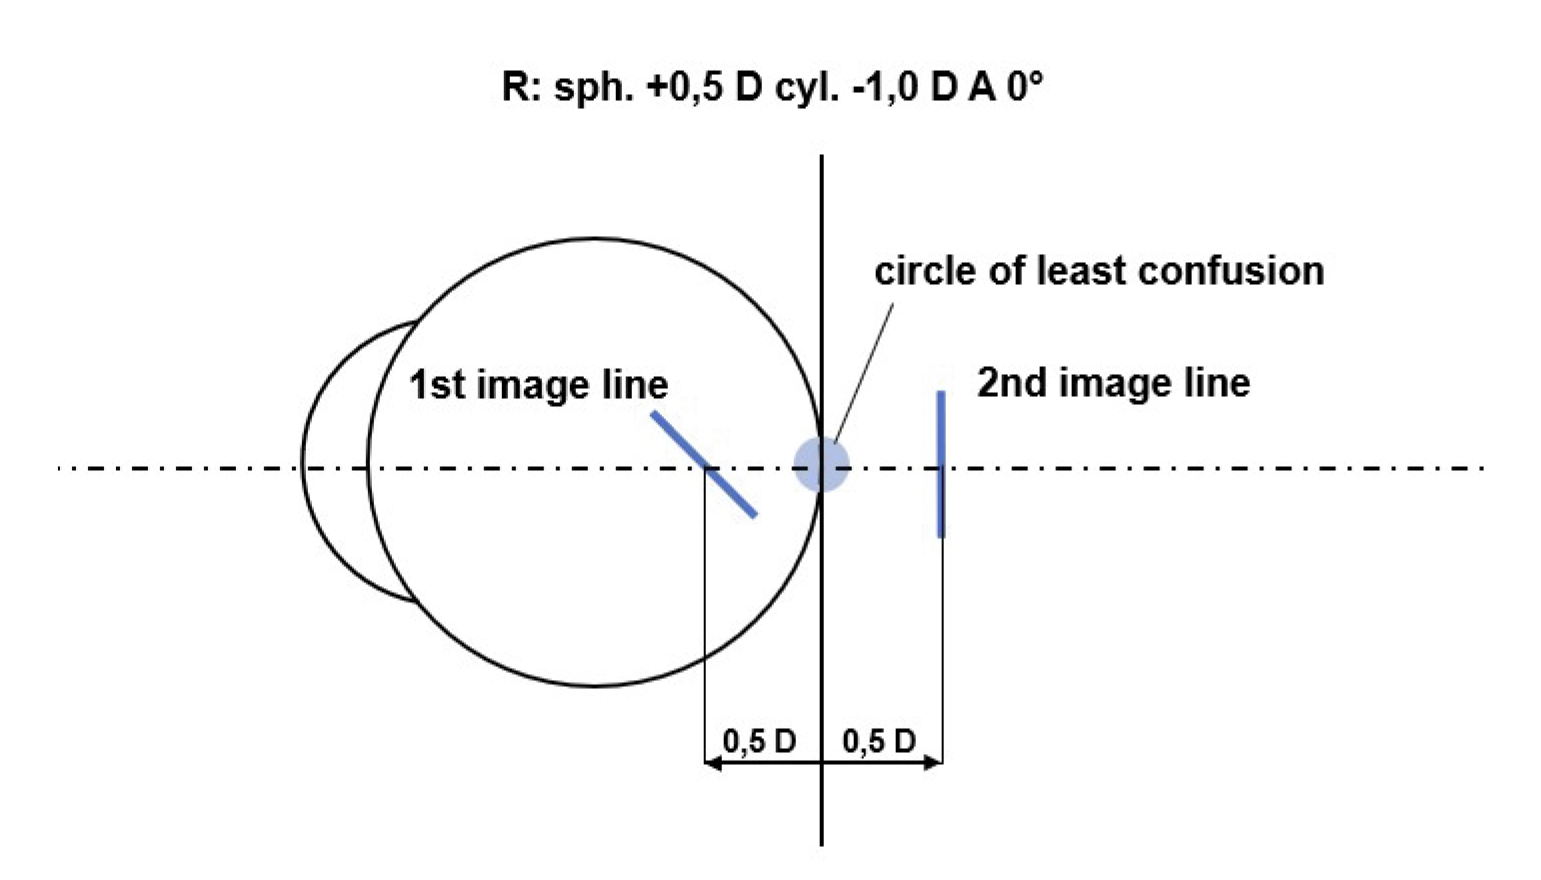
A mixed astigmatism is present when one principal meridian is myopic while the other is hyperopic. As a result, one image line lies in front of the retina and the other behind it. A mixed astigmatism is considered symmetrical when the image lines are positioned at equal distances in front of and behind the retina (Figure 1).
In the presence of mixed astigmatism, its magnitude can be estimated using the resulting visual acuity and the following rule of thumb (Formula 1). According to this, an uncorrected astigmatic difference of 1.0 diopter results in a halving of visual acuity.2 Assuming an example visual acuity of 1.6 and an astigmatic difference of 1.0 diopter, the resulting reduced visual acuity would be 0.8.
(Formula 1)
V = Vmax • 0,5DAst
V = 1,6 • 0,5 1,0 D = 0,8
However, factors such as overall refractive error and individual visual acuity are not taken into account, which is why this rule of thumb should be used with caution.
When an image falls on a retinal area that is not associated with the oculocentric direction "straight-ahead" but still lies within the Panum’s area, horizontal disparity occurs.
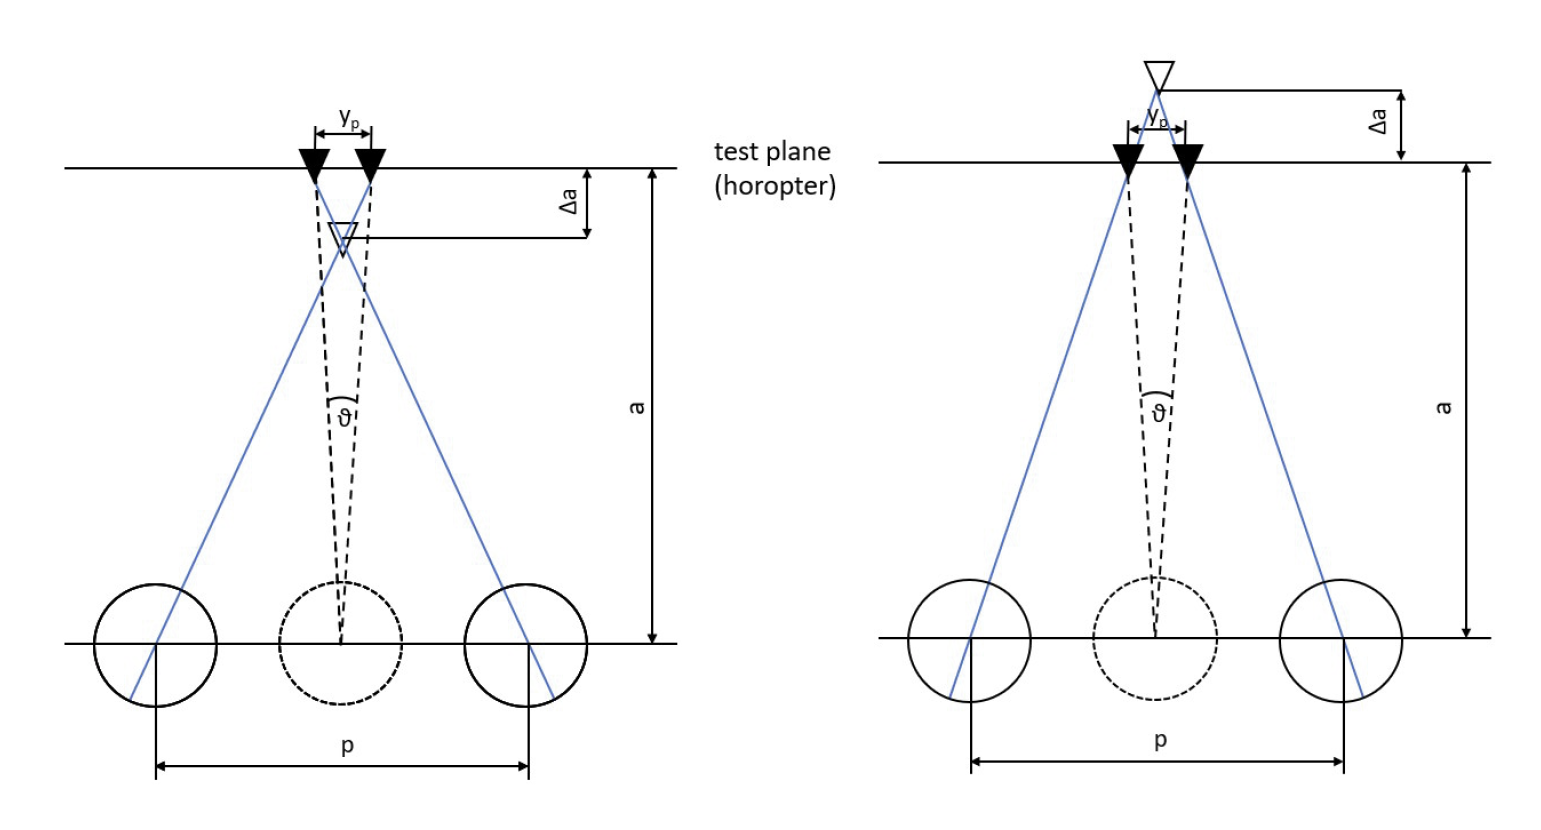
If an object is imaged with horizontal disparity within the Panum’s area in at least one eye, binocular depth perception, stereopsis, can occur. Depending on the direction of the horizontal disparity (nasal/temporal), a distinction is made between crossed and uncrossed disparity (Figure 2). Crossed (temporal) disparity results in a perception of depth in front of the plane of fixation, whereas uncrossed (nasal) disparity leads to a perception of depth behind it (Figure 2).
The threshold of stereopsis ϑ (ST) refers to the smallest perceivable horizontal disparity. It is calculated based on the stereoscopic parallax y_p and the testing distance a (see Formula 2).
(Formula 2)
tanϑ = yp/a
Blur adaptation refers to the ability of the visual system to adjust to blurred visual stimuli. In subjects with astigmatic refractive error, a kind of "adaptation effect" occurs, allowing blurry, distorted objects to be perceived more clearly. Sawides et al. demonstrated that temporary exposure to blurred images leads to a lasting improvement in perception, even after the blur is removed.3
The underlying mechanism of this adaptation is described by de Gracia et al. to neural adjustments in the visual cortex.4 This is supported by experiments showing that visual acuity in subjects with natural astigmatism was less affected by simulated distortion than in a control group without astigmatism.
Material and Methods
A total of 40 subjects took part in the study, divided into two age groups in order to examine the influence of accommodation on the stereo threshold in the presence of simulated mixed astigmatism.
Group 1 consisted of 20 individuals aged 18 to 30 years, characterized by a higher maximum amplitude of accommodation. Group 2 also included 20 individuals, all over the age of 50, with a lower maximum amplitude of accommodation.
The same inclusion and exclusion criteria applied to both groups. At minimum, gross stereopsis was required. This was determined at the beginning of the measurement using the Lang Stereotest I. In addition, a monocular decimal visual acuity of at least 0.8 (logMAR value 0.1) with best possible correction was required. Subjects were excluded from the study if the monocular visual acuity differed by more than one logMAR level between the right and left eye.
Furthermore, the presence of anisometropia greater than two diopters led to exclusion, due to potential fusion issues and differing amplitudes of accommodative between the eyes.
Individuals who were already wearing prismatic correction due to a clinically relevant heterophoria or strabismus were also excluded from the study.
The measurements were conducted at the optometry lab of the Berlin University of Applied Sciences (Berliner Hochschule für Technik). The study was performed in accordance with the revised Declaration of Helsinki, the ethics and data protection regulations of the Berlin University of Applied Sciences (BHT), as well as the relevant legal requirements. Each participant provided written informed consent at the beginning of the measurement. The examination rooms meet the requirements for performing subjective refraction measurements according to DIN EN ISO 8596.
This is a non-randomized cross-sectional study without a control group. The tests were standardized and performed using the Visucat vision testing device. The simulated astigmatism (0.5 D and 1.0 D) was created in three axis positions (90°, 0°, 45°) using cylindrical lenses. For this purpose, astigmatic powers of 0.5 diopters and 1.0 diopters were used, simulating rectus astigmatism, inverse astigmatism, and oblique astigmatism.
At the beginning of the measurement, a subjective refraction was performed based on the cross-cylinder method. The refractive balance was also established, and the maximum amplitude of accommodation was determined monocularly. This was followed by the measurement of monocular and binocular visual acuity using Landolt rings, as well as the determination of the initial threshold of stereopsis. To determine visual acuity as precisely as possible, the interpolated logMAR method was used. This means that correctly and incorrectly identified optotypes are counted during the subjective refraction, from which the interpolated logMAR value can be calculated based on the logarithmic scaling of the acuity grades. In a line with five optotypes, each optotype is weighted as 0.02 log units.5 For example, if a participant correctly identifies four optotypes at a visual acuity level of 1.25 (logMAR 0.1) and then identifies two additional optotypes in the following line (V = 1.6; logMAR 0.2), 0.02 logMAR is added for the incorrectly identified optotype. For the two additional correctly recognised visual symbols, 0.02 logMAR is subtracted from the last line passed. The interpolated logMAR value for the participant is therefore -0.12.
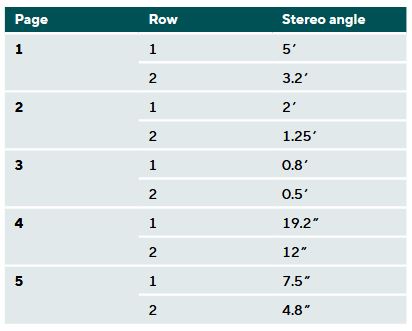
Trial lenses were then placed in the trial frame to simulate symmetrical mixed astigmatism. Under this condition, binocular visual acuity and the threshold of stereopsis were determined using the stereo acuity test D10 according to Stollenwerk. This test is a logarithmically scaled method for determining the stereo threshold, where the presented threshold of stereopsis decreases by a factor of 1.6 with each line. On five pages, two rows of five vertical black bars are presented. In each row, exactly one randomly selected bar serves as the stereopsis object. The two outer bars never produce a stereoscopic effect. This information will not be communicated to the subjects. Using the initial values and two astigmatic powers, each presented in three cylinder axes, binocular visual acuity and threshold of stereopsis were recorded a total of seven times. The scaling of the stereo acuity test D10 can be found in Table 1.
Results
The younger subjects achieved an average binocular visual acuity of -0.23 logMAR (V = 1.7) with fullcorrection of their refractive error. The median was -0.26 logMAR (V = 1.8). In the older subjects, an average binocular visual acuity of -0.16 ogMAR (V = 1.5) was measured. The median had the same value.
Next, a mixed astigmatism of 0.5 diopters was simulated in the described axis positions. The results of the three axis orientations were averaged for each respective power. The younger subjects had an average visual acuity of -0.19 logMAR (SD = 0.08). The median was -0.21 logMAR (V = 1.6). The age group over 50 years achieved a mean binocular visual acuity of -0.12 logMAR (SD = 0.06). The median here was -0.12 logMAR (V = 1.3).
The simulation of the higher mixed astigmatism with a power of 1.0 diopter resulted in an average visual acuity of -0.08 logMAR (SD = 0.06) in the younger participant group. The median was -0.06 logMAR (V = 1.2). The older participant group had an average visual acuity of -0.01 logMAR (SD = 0.11) with a median of -0.01 logMAR (V = 1.0). Contrary to the rule of thumb, this astigmatic difference did not halve visual acuity in either participant group.
Subsequently, the effect of the simulated astigmatism (0.5 D, 1.0 D) on binocular visual acuity was examined without considering age groups using a repeated measures ANOVA. The median visual acuity initially was -0.18 logMAR. With the simulation of 0.5 diopters of astigmatism, it worsened to -0.15 logMAR, and with 1.0 diopter simulated astigmatism, to -0.05 logMAR. Based on the medians, it is evident that logMAR visual acuity deteriorated with increasing simulated astigmatism.
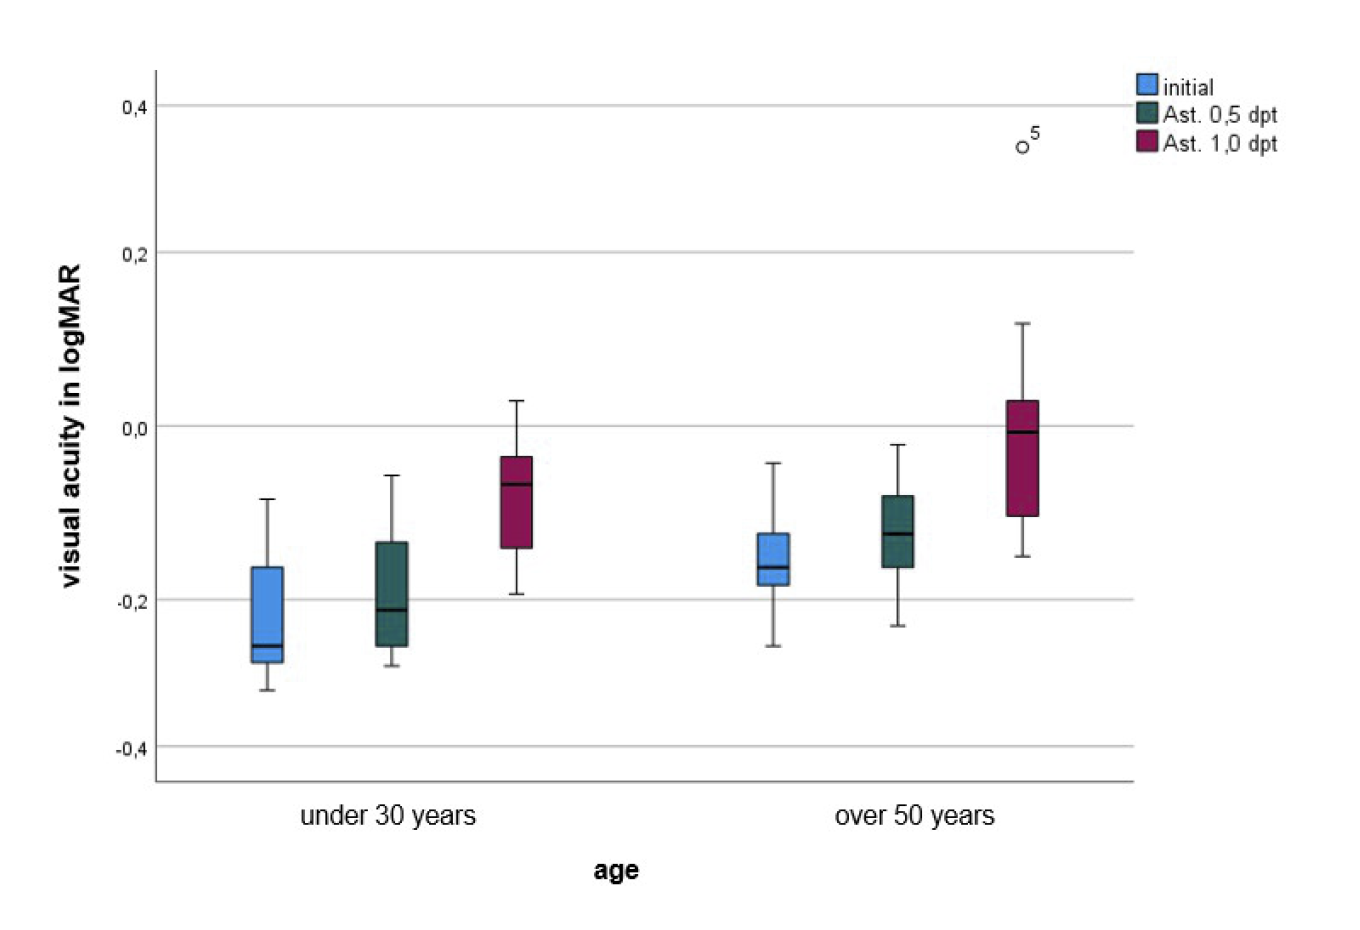
The ANOVA with repeated measures showed that visual acuity without simulated astigmatism was significantly better than with both 0.5 D and 1.0 D simulated astigmatism (p < 0.001). Additionally, there was a significant difference between the two astigmatism powers (0.5 D and 1.0 D), with visual acuity being significantly worse at 1.0 D than at 0.5 D (p < 0.001). The medians of the respective binocular visual acuity, divided by age groups, are shown in Figure 3.
Since the stereo acuity test D10 is a logarithmically scaled test, the measured threshold of stereopsis were analyzed as logarithmized data. The initial threshold of stereopsis of the younger group averaged a logST of 0.97 (SD = 0.29), which corresponds to a ST of 9.33 arcseconds. The older age group of subjects had a mean logST of 1.17 (SD = 0.33), corresponding to a ST of 14.79 arcseconds. The median for both age groups was 1.08 (corresponding to a ST of 12.02 arcseconds).
Next, the results from the different axis orientations were averaged to evaluate the influence of the simulated astigmatism power. When simulating the lower astigmatism of 0.5 diopter, a deterioration in stereoacuity was observed in the younger group. An average logST of 1.13 (SD = 0.28), corresponding to a ST of 13.49 arcseconds, was measured. The median in this group was 1.08 logST (corresponding to a ST of 12.02 arcseconds). The participant group over 50 years achieved a mean logarithmized ST of 1.35 (SD = 0.35), equivalent to a ST of 22.39 arcseconds. The median was also 1.35 logST.
The simulation of the higher astigmatism with a power of 1.0 diopter resulted in a further deterioration. The younger group reached a mean logST of 1.22 (SD = 0.30), corresponding to a ST of 16.60 arcseconds. The median was 1.15 logST (corresponding to 14.13 arcseconds). In the older participant group, a mean logST of 1.54 (SD = 0.37), equivalent to 34.67 arcseconds, was measured. The median here was 1.55 logST (corresponding to 35.38 arcseconds).
Furthermore, it was examined whether the initial threshold of stereopsis differed from the threshold of stereopsis with simulated astigmatism of 0.5 D and 1.0 D. The Analysis of Variance (ANOVA) test with repeated measurements confirmed the increase in medians with increasing astigmatism.This suggests that the threshold of stereopsis measurements increased with higher simulated astigmatism, resulting in a deterioration of stereoacuity. Here, too, all three conditions differed significantly from each other, each with p < 0.01.
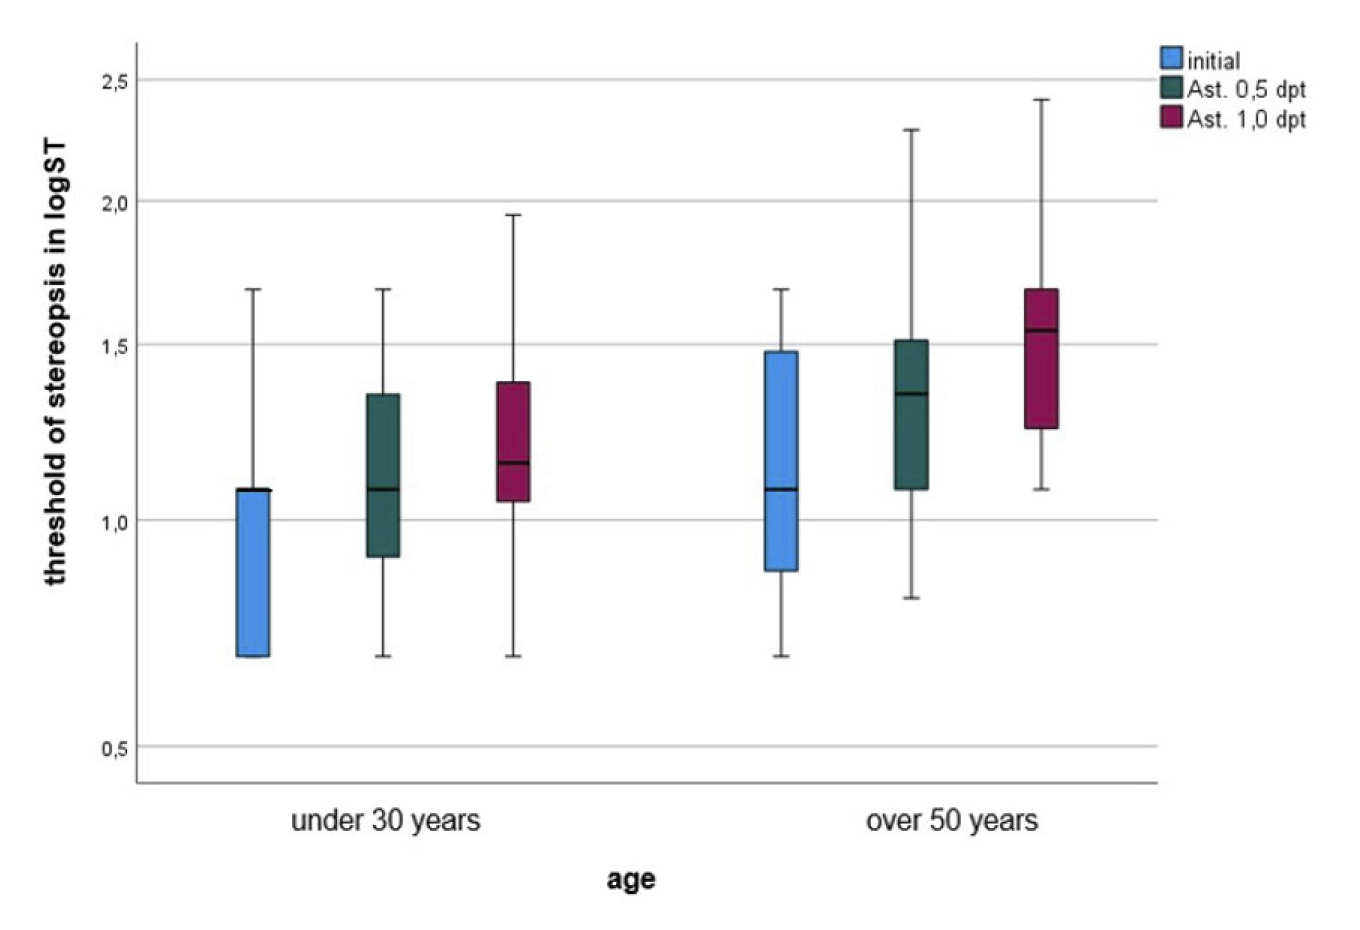
Figure 4 shows the medians of the logST without and with the astigmatic powers in the age groups. The increase in the medians of the logST represents a deterioration of stereoacuity.
To examine whether the axis orientation of the simulated astigmatism influences the threshold of stereopsis, the non-parametric Friedman test was applied. This test was performed separately for the simulated astigmatism of 0.5 D and 1.0 D. Additionally, the correlation coefficient r was calculated for the pairwise comparisons.
Astigmatism 0,5 D
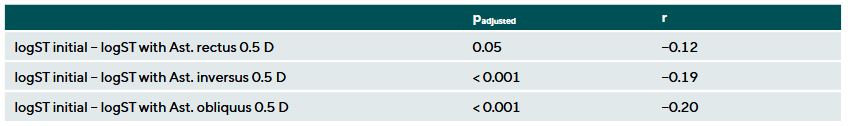
The Friedman test was able to detect at least one significant difference between the initial threshold of stereopsis and the threshold of stereopsis with simulated astigmatism of 0.5 D across the tested axis positions (astigmatism rectus, astigmatism inversus, astigmatism oblique) (p < 0.001, n = 40). The following post-hoc test showed that there was no significant difference between the initial threshold of stereopsis and the threshold of stereopsis under 0.5 D astigmatism rectus (padjusted = 0.05, r = -0.12). However, significant differences were found for 0.5 D astigmatism inverse (padjusted < 0.001, r = 0.19) and 0.5 D astigmatism oblique (padjusted < 0.001, r = -0.20). This indicates that especially astigmatism-against-the-rule and oblique astigmatism impair stereopsis, while rectus astigmatism does not show a significant effect (Table 2).
Astigmatism 1,0 D
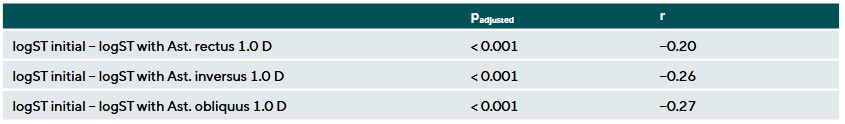
The Friedman test showed a significant difference between the initial threshold of stereopsis and the threshold of stereopsis under simulated astigmatism of 1.0 D in the three tested axis orientations (p < 0.001, n = 40). The following post-hoc test confirmed significant differences between the individual axis positions. Pairwise comparisons revealed a significant deterioration of the threshold of stereopsis with 1.0 D astigmatism rectus (padjusted < 0.001, r = -0.20), 1.0 D astigmatism inversus (padjusted < 0.001, r = -0.26), and 1.0 D astigmatism oblique (padjusted < 0.001, r = -0.27). This indicates that a higher astigmatism significantly impairs stereopsis in all tested axis orientations (Table 3).
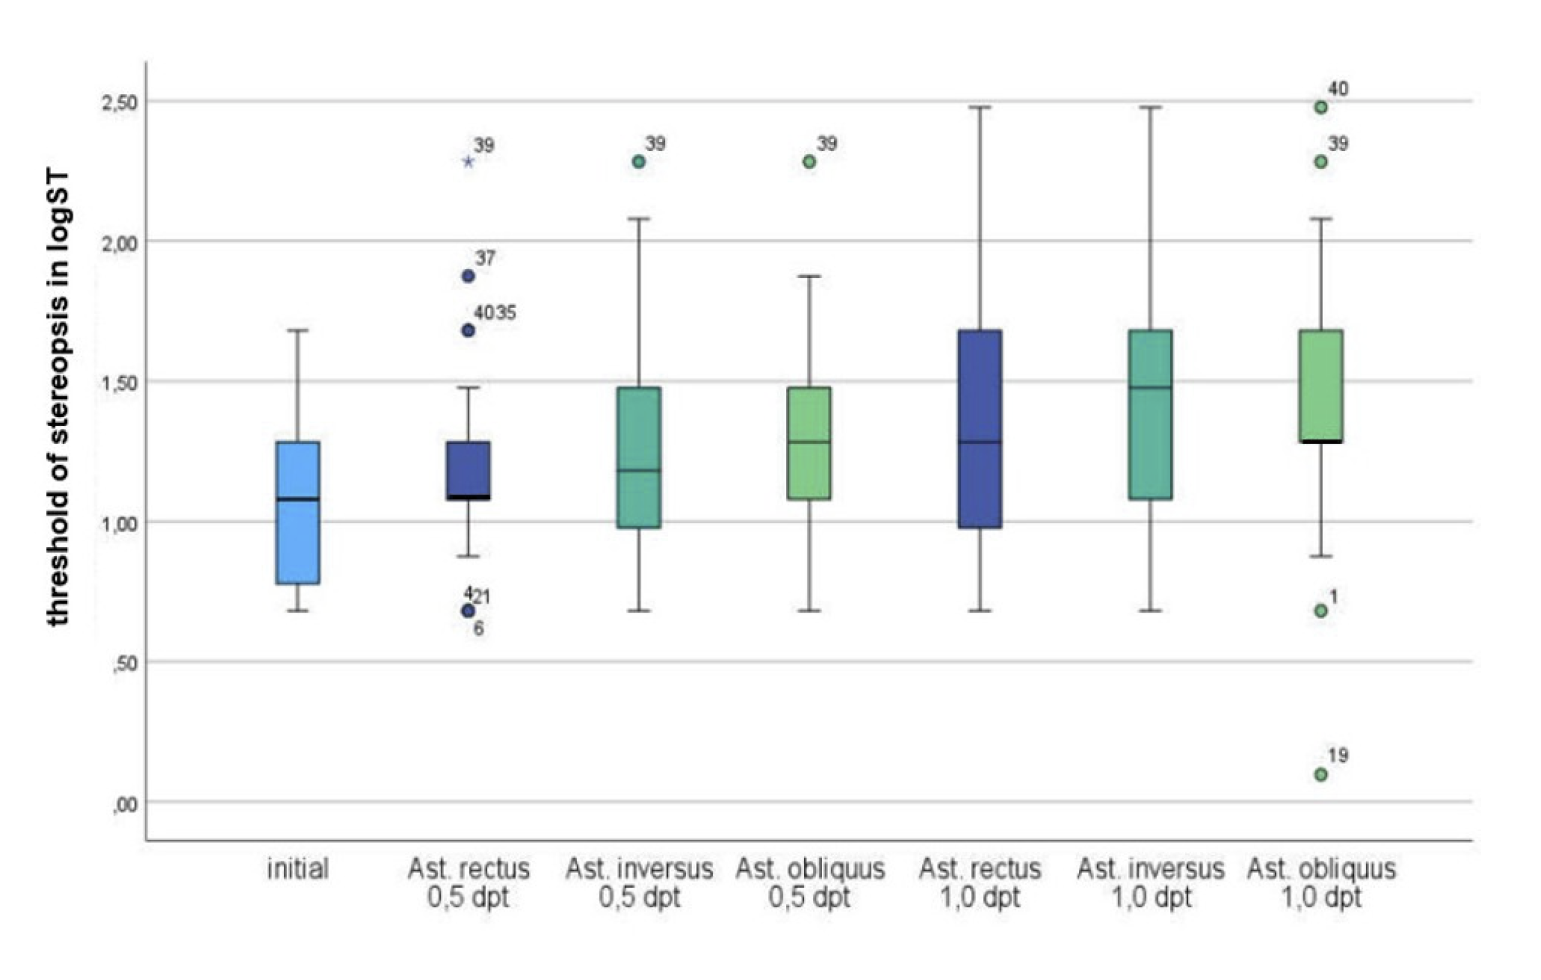
Figure 5 shows the graphical representation of the threshold of stereopsiss and their medians without and with the simulated astigmatism at the two magnitudes of 0.5 D and 1.0 D across the three axis orientations. The data from all subjects were analyzed without considering the age groups.
Finally, the influence of age on the threshold of stereopsis with simulated astigmatism was examined. This hypothesis was formulated to investigate a possible effect of the subjects’ maximum amplitude of accommodation with simulated mixed astigmatism. For the evaluation of the hypotheses, the difference between the initial threshold of stereopsis and the threshold of stereopsis with simulated astigmatism in the three tested axis orientations was calculated.
Astigmatism 0,5 D
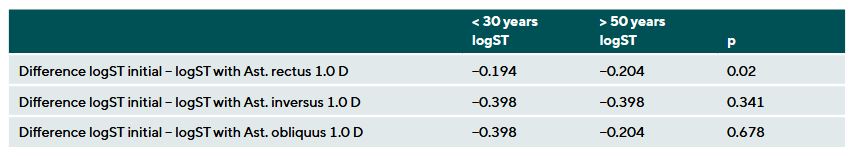
It was examined whether the differences in threshold of stereopsiss with and without simulated mixed astigmatism in the three different axis orientations differ between the two age groups. For the astigmatism of 0.5 D, no significant difference between subjects under 30 years and those over 50 years could be detected using the Mann-Whitney U test (p > 0.05, n1 = 20, n2 = 20). The exact p-values are listed in Table 4.
Astigmatism 1,0 D
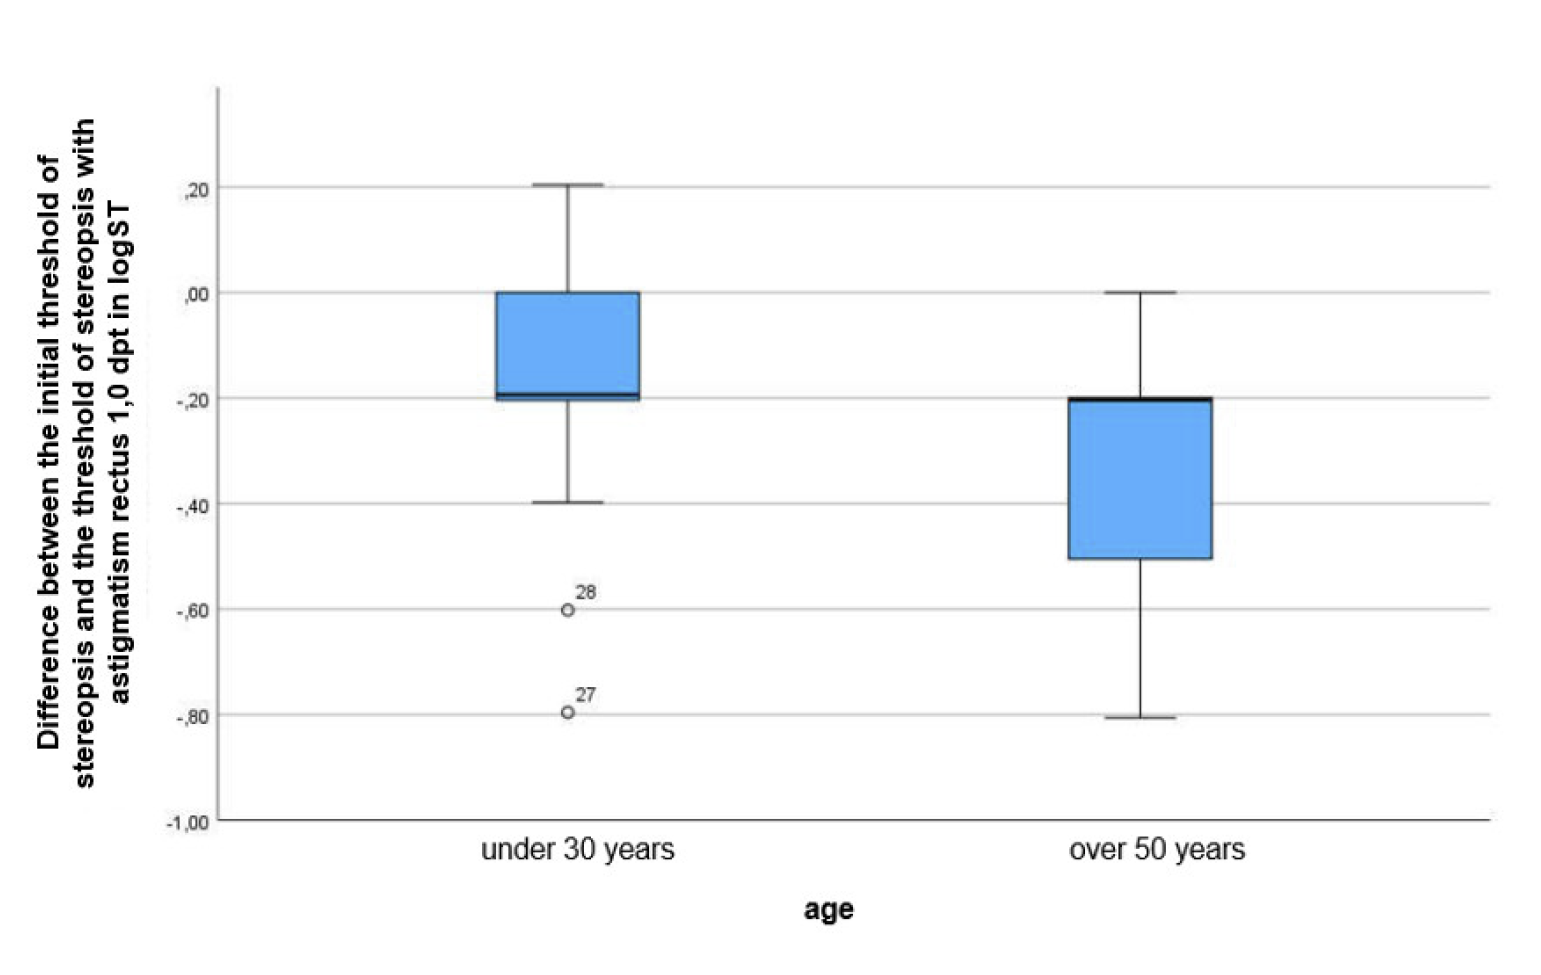
For a simulated astigmatism of 1.0 D, a significant difference in the differences of the threshold of stereopsis was observed for the “rectus” meridian between the two age groups (group > 30 years: median = 0.19, group > 50 years: median = 0.20, p = 0.019, n1 = 20, n2 = 20). Although the medians are almost the same, Figure 6 shows that the data distributions in the two age groups differ greatly. While the measurements of the under-30 group are mostly concentrated in the lower quartile with the upper 25 % showing greater variability. The over-50 group shows the opposite distribution: the median is near the upper quartile, with the upper 25 % of the data being less variable, while the lower 25 % show greater diviation. Only in cases of for astigmatism rectus of 1.0 D did older subjects exhibit significantly worse stereopsis than younger subjects (p = 0.019). No significant differences were found for astigmatism inverse and oblique (Table 4).
Discussion
The results confirm that even slight astigmatisms (starting from 0.5 D) causes a deterioration in visual acuity and stereopsis, even if the deterioration is minor. This highlights the importance of accurately correcting even minor astigmatic refractive errors.
The simulated astigmatism led to a significant deterioration in visual acuity. The median binocular visual acuity decreased from -0.18 logMAR (V = 1.51) without astigmatism to -0.15 logMAR (V = 1.41) with a simulated astigmatism of 0.5 D. At 1.0 D, visual acuity further worsened to -0.05 logMAR
(V = 1.12). According to the rule of thumb, a visual acuity of -0.03 logMAR (V = 1.07) would have been expected at 0.5 D simulated astigmatism, and 0.12 logMAR (V = 0.76) at 1.0 D simulated astigmatism. The repeated measures ANOVA confirmed significant differences between the three conditions (p < 0.001).
The simulated astigmatism led to a significant deterioration of the threshold of stereopsis. Without astigmatism, the median threshold of stereopsis was 1.08 logSGW (12.02”). With a simulated astigmatism of 0.5 D, the threshold of stereopsis worsened to 1.15 logSGW (14.03”), and increased further to 1.28 logSGW (19.19”) at 1.0 D. ANOVA with repeated measures showed significant differences between these conditions (p < 0.001). These results are consistent with the study by Gagal and Parekh, which demonstrated that increasing astigmatism impairs stereopsis, with the effect being especially pronounced at higher cylinder values. Furthermore, stereopsis deteriorates more with induced monocular astigmatism than with binocular astigmatism.6 These findings complement and support the results of Rassow and Wesemann.7 Despite different methodological approaches, both studies show that monocular strain on the visual system have the strongest impact on stereopsis.
The cause of this decline is the blur of the retinal images, as stereopsis requires as sharp retinal images as possible. This is consistent with previous studies that link reduced visual acuity to a decline in stereopsis.
The deterioration was also dependent on the axis orientation of the astigmatism. Astigmatism oblique (45°) caused the greatest impairment, while astigmatism (90°) rectus with 0.5 D had little effect on the threshold of stereopsis. However, at 1.0 D, astigmatism rectus also led to a significant deterioration.
Additionally, it was observed that older subjects showed a greater impairment of the threshold of stereopsis due to the simulated astigmatism. However, a significant difference between the age groups was only found for astigmatism rectus at 1.0 D (p = 0.019). This could be due not only to reduced accommodative ability but also to neural factors.
In this study, visual acuity and threshold of stereopsis were measured immediately after insertion of the cylindrical lens to simulate astigmatism. The subjects were therefore not given any adaptation time to the new visual impression, so it can be assumed that blur adaptation had no significant influence on the measurements. Astigmatism was simulated binocularly with the same magnitude and axis in both eyes, thus maintaining the previously established refractive and accommodative balance. In contrast, the results of Gagal and Parekh as well as Rassow and Wesemann show that monocular simulation impairs stereopsis more strongly. This is due to the differently sharp and distorted retinal images in each eye, which make fusion more difficult and thereby reduce stereopsis. Additionally, the fine gradations of the stereo acuity test D10 allowed precise measurement of the stereopsis threshold.
The assumption that accommodation of the posterior image line has less impact on stereopsis could not be fully confirmed. While no deterioration was observed with 0.5 D astigmatism rectus, an astigmatism of 1.0 D led to a reduction in stereopsis regardless of the axis orientation. However, astigmatism rectus caused the smallest negative impact of stereopsis. Future studies with higher astigmatism values and larger sample sizes could clarify whether this effect provides an advantage in the stereo acuity test D10.
Conclusion
The study shows that even small astigmatic refractive errors can significantly reduce visual acuity and stereopsis. This highlights the importance of full correction of refractive errors, especially for individuals with astigmatism. Age-related changes in accommodative also affect the quality of depth information. In clinical practice, even minor astigmatic errors should be corrected to optimise stereopsis. Regular eye examinations and precise correction of refractive errors are especially important for people with reduced accommodation to provide the best possible visual acuity and stereopsis.
Conflict of interest
The authors declare that there is no conflict of interests regarding the methods and devices mentioned in the article.

About Johanna Sacha
M.Sc. - Berliner Hochschule für Technik (BHT), Berlin, Germany
COE Multiple Choice Questionnaire
The publication "Influence of astigmatism on stereopsis" has been approved as a COE continuing education article by the German Quality Association for Optometric Services (GOL). The deadline to answer the questions is 1. Juli 2026. Only one answer per question is correct. Successful completion requires answering four of the six questions.
You can take the continuing education exam while logged in.
Users who are not yet logged in can register for ocl-online free of charge here.