Influence of Saline Solutions on Soft Contact Lenses
Purpose: The aim was to analyze the pH value and refractive index of various saline solutions and tap water. Additionally, the study examined their impact on the design parameters base curve (BC), diameter (DIA) and central thickness (CT) of soft contact lenses.
Material and Methods: pH values and refractive indices were measured using a pH-meter and refractometer. The design parameters of n = 15 lenses per material group were assessed via OCT: immediately after removal from the blister solution, after 24 hours of storage in a self-prepared saline solution and after an additional 24 hours in one of four commercial solutions or tap water.
Results: Commercial saline solutions showed minor differences in pH (± 0.622) and refractive index (± 0.0008). The Oté Pharma Sol B.V. solution had the lowest pH (6.477). The greatest changes occurred in Etafilcon A (Material Group 4) in the Bausch + Lomb solution, with increased DIA by 0.753 ± 0.03 mm and BC by 0.495 ± 0.08 mm. In tap water the DIA increased by 1.465 ± 0.035 mm and the BC by 1.091 ± 0.87 mm. Other materials (Polymacon, Nefilcon A, Balafilcon A, Lotrafilcon B, Somofilcon A) remained within the ISO tolerance limits (± 0.2 mm).
Conclusion: The study reveals variations in pH values and corresponding changes in DIA and BC, particularly in material group 4 with the Bausch + Lomb solution and tap water. An influence of the pH value is suspected, but further investigations are required.
Introduction
The market analysis conducted by the Central Association of Ophthalmic Opticians and Optometrists (ZVA) for the year 2022 highlights the growing importance of contact lenses and associated care products: The sales in this sector increased by 14.5 %, reaching 609 million Euros. Despite this positive development, improving the compatibility of contact lenses remains a challenge, with dropout rates still ranging between 15.9 % and 34 %.1 Even innovative materials have so far failed to significantly resolve this issue.2
Noncompliance with recommended contact lens care and wearing instructions is a widespread problem, affecting between 40 % and 91 % of contact lens users. Especially in areas such as hygiene, the use of cleaning solutions, adherence to recommended replacement schedules and wearing time, many users exhibit incorrect behavior. A common mistake is the storage of lenses in rinsing solutions or tap water.3 This practice carries not only a risk of microbial contamination but may also affect lens stability and fit, as the chemical composition of tap water differs from that of the tear film.
Saline solutions, commonly used for rinsing contact lenses, play a key role in lens care. Its chemical and physical properties, such as pH value and the presence of preservatives and buffering agents, have a significant influence on wearing comfort and the optical and geometric parameters of the lenses. These effects are further influenced by external factors such as temperature and care solutions. For instance, a study by Ozkan et al. demonstrated that parameters like diameter and base curve are temperature-dependent. Lenses made from materials such as Etafilcon A and Comfilcon A showed significant shrinkage when the temperature increased from 21 °C to 35 °C.4 Similar effects were documented by Tranoudis and Efron, who reported reductions in water content and overall diameter with a temperature rise from 20 °C to 35 °C.5
The stability of silicone hydrogel lens parameters also varies depending on the multipurpose solution used. Smith et al. found that lens diameter and central thickness can change significantly with different solutions.6
Moreover, studies have shown that the chemical properties of contact lens care products and eye drops can affect comfort and lens compatibility. Peña-Verdeal et al. reported that a low pH value could impair lens hydration and promote lens adherence.7 Ahn et al. also analyzed how pH affects the physical properties of lens materials, finding that lenses made of Etafilcon A are particularly sensitive to pH changes, which affects water content, diameter and refractive power. In contrast, lenses made of Hilafilcon B showed little to no comparable effects.8
In light of these findings, the present study investigates how different saline solutions and tap water affect the design parameters of soft contact lenses. The focus is on changes in diameter (DIA), central thickness (CT) and base curve (BC) of lenses from material groups 1, 2, 4 and 5 in accordance with DIN EN ISO 18369-1. In addition, the refractive index (n) and pH value of the test liquids are analyzed.
The study is based on the assumption that, despite regulatory standards, saline solutions from different manufacturers differ in composition, which may potentially influence the parameters of soft contact lenses.
The following assumptions were formulated: First, it is assumed that the pH value varies between different commercially available saline solutions. Furthermore, it is expected that the diameter, base curve and centre thickness of soft contact lenses will change in different saline solutions. Additionally, it is assumed that a higher pH value may lead to an increase in lens diameter and base curve.

Materials and Methods
A standard saline solution was prepared in accordance with ISO 18369-3 and served as a reference for comparison with commercial products and tap water. The following high-purity chemicals were used to ensure consistency and precision:
• Water (2.5 L): ISO 3696 Type 3, demineralized
• Sodium chloride (500 g): Cellpure ≥ 99.5 %
• Sodium dihydrogen phosphate (100 g): ≥ 98 %, anhydrous, analytical grade
• Disodium hydrogen phosphate (500 g): ≥ 98 %, Ph. Eur., USP, anhydrous
To prepare the saline solution, 8.300 g of sodium chloride, 0.406 g of sodium dihydrogen phosphate and 2.376 g of disodium hydrogen phosphate were dissolved in 1000 ml of water (ISO 3696:1987, Grade 3). Due to the use of anhydrous chemicals, the solution was expected to exhibit a pH value of 7.4 ± 0.1 and an osmolarity of 310 mOsm/kg ± 5 mOsm/kg.9 Figure 1 illustrates the equipment used for the preparation and verification of the saline solution.
Contact lenses from material groups 1, 2, 4, 5A, 5B and 5C (DIN EN ISO 18369-1) were selected for the study, each with a refractive power of −3.00 D. Material group 3 was excluded due to lower market relevance.10 A total of 90 lenses were analyzed, with each material group represented by 15 lenses. Table 1 summarizes the lenses and their key parameters.
Four commercially available saline solutions were tested to assess their influence on lens parameters. Manufacturer information and solution composition are listed in Table 2. Tap water from the Ernst Abbe University of Applied Sciences Jena (EAH) was also analyzed (supply area: Jena Fernwasserversorgung).11
Various instruments were used for the analysis of lens and solution parameters. All measurements were performed at a constant room temperature of 22.5 °C and a humidity of 49 %. The pH was measured using the Handylab pH 11 (Schott Instruments, Mainz, Germany), which applies the potentiometric method. A glass electrode measures the electric potential at the electrode-solution interface, balanced by a reference electrode. The voltage difference is directly proportional to the pH and displayed on-screen, providing an accurate assessment of the solution’s acidity or alkalinity.12 The pH value of the blister solutions was immediately measured after opening using approximately 0.3 ml of sample. The homemade reference solution was analyzed directly by immersing the probe into the container. For commercial saline solutions and tap water, 10 ml samples were placed in glass containers and measured under ambient air exposure.


Refractive index was determined using the VariRef C 2 refractometer (Schmidt + Haensch, Berlin, Germany), which analyzes total internal reflection of a light beam transmitted through a prism of known refractive index. By varying the angle of incidence, the critical angle is measured - this is the point at which refraction no longer occurs and the light beam runs parallel to the boundary surface. With the help of this critical angle and the refractive index of the prism, the refractometer can determine the refractive index of the sample.13 For each measurement, approximately 0.03 ml of liquid was placed on the device’s surface, enclosed and thermally equilibrated to 20 °C before measurement.
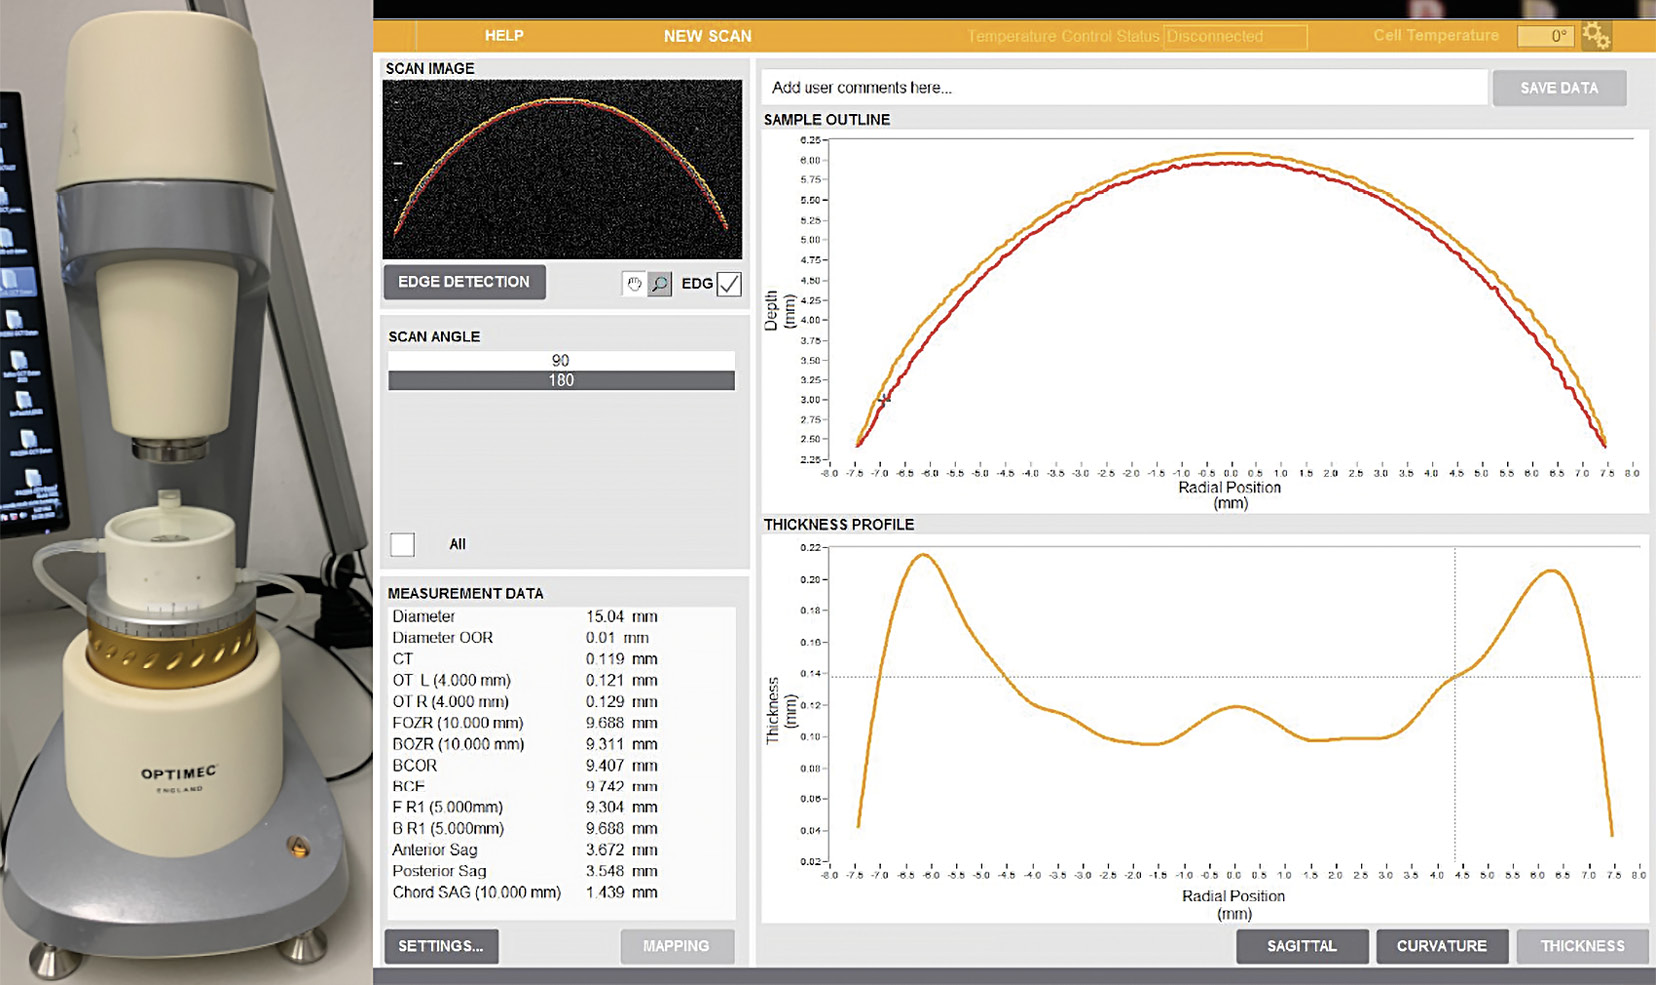
For measuring DIA, CT and BC, the Optimec is830 OCT device (Optimec Systems, Malvern, UK) was used. This device is based on Michelson interferometry and employs near-infrared light to generate high-resolution cross-sectional images of the lenses.14 Figure 2 presents the OCT device and a screenshot of the data analysis.
The salt content of the saline solutions was determined using the PCE-MA 50X moisture analyzer (PCE Instruments, Meschede, Germany), which combines a precision scale with a halogen heating element. The solution is evaporated at 100 °C until no further mass loss occurs. The difference between the initial and final weight indicates the solid content, primarily the salt concentration and enables fast and reliable results.15
Procedure
Before the investigation began, all devices and materials were prepared and both the pH meter and the precision scale were calibrated.
On the first day, the investigation started with the preparation of the saline solution according to the specifications of DIN 18369. The components were weighed, placed into a glass container, mixed with distilled water and after 10 minutes of thorough stirring, the pH value was checked. The refractive index of the solution was measured using a refractometer.
All contact lenses were removed from their packaging, rinsed and transferred into the wet cell of the OCT. The wet cell was filled with Lens Plus OcuPure for the measurement. OCT was then used to record the geometry of the lenses. After measuring the lenses in their blister solution, they were transferred to multiwell plates, filled with the self-prepared saline solution and equilibrated in it for 24 hours.
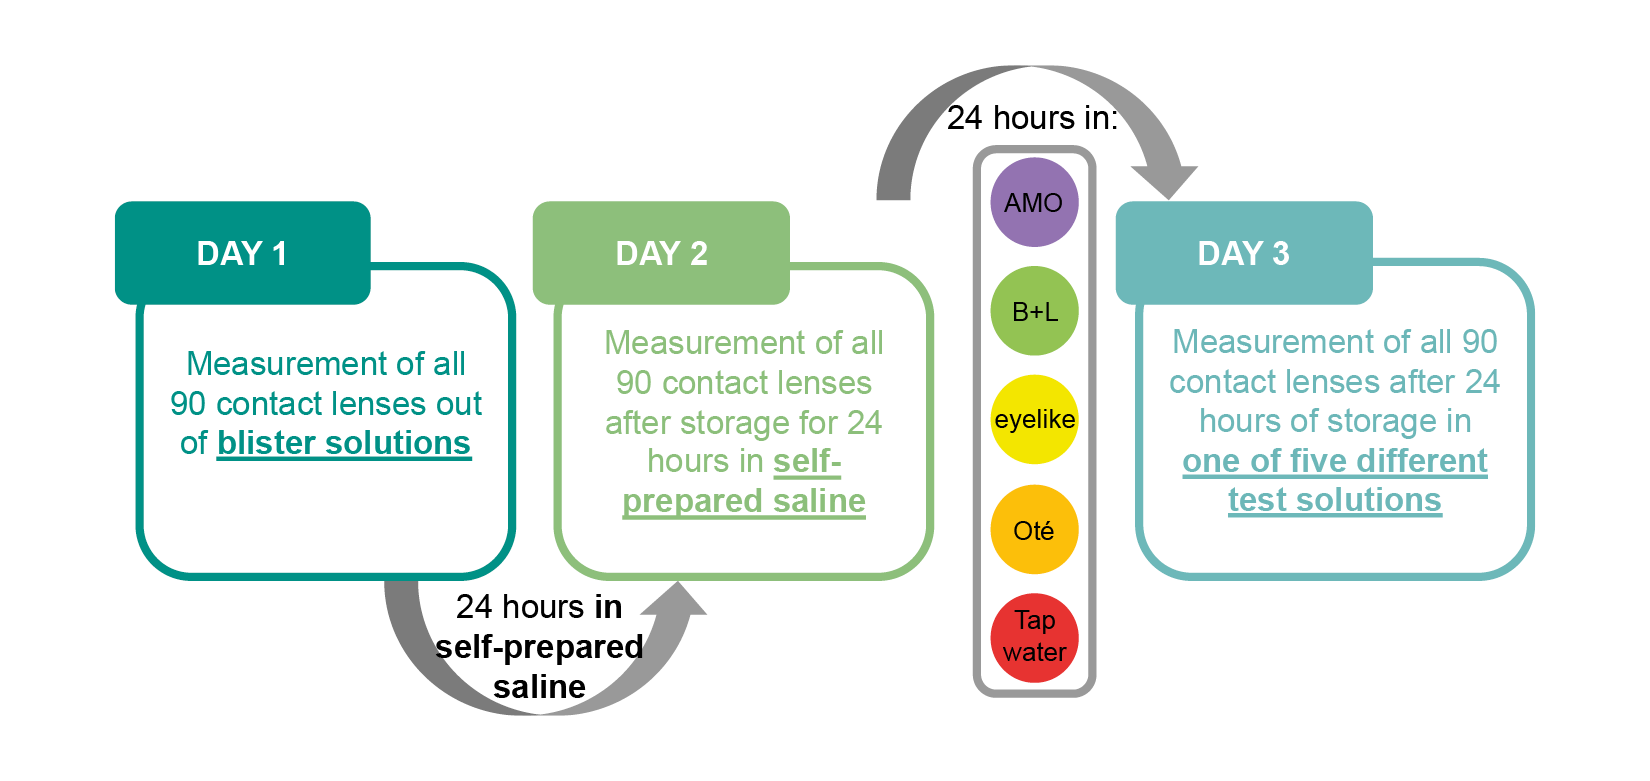
On the second day, the lenses were measured again after 24 hours of storage in the homemade solution. The wet cell of the OCT device was also filled with the homemade solution. All lenses were measured under the same condition as on the first day and the data was recorded. In the next step, three lenses from each of the five material groups were immersed in one of five different solutions (including commercial solutions and tap water) and stored for 24 hours. On the third day, final measurements were taken. The lenses were once again measured using the OCT device. The wet cell of the OCT device was filled with the same solution in which the lenses had been stored over the past 24 hours. Figure 3 provides a visual overview of the experimental procedure.
After the final measurement, the lenses were transferred for drying. The salt content of the commercial solutions was determined using the Moisture Analyzer PCE-MA 50X.
Results
The pH values of the different solutions showed clinically relevant differences. The solution from Oté had a slightly acidic pH value of 6.477, while tap water was classified as alkaline with a pH of 8.376. The refractive indices also varied. The blister solutions showed greater variability (∆ = 0.0026) compared to the commercial saline solutions, which differed only minimally (∆ = 0.0008). Detailed results for pH and refractive index can be found in the Tables 3 and 4.
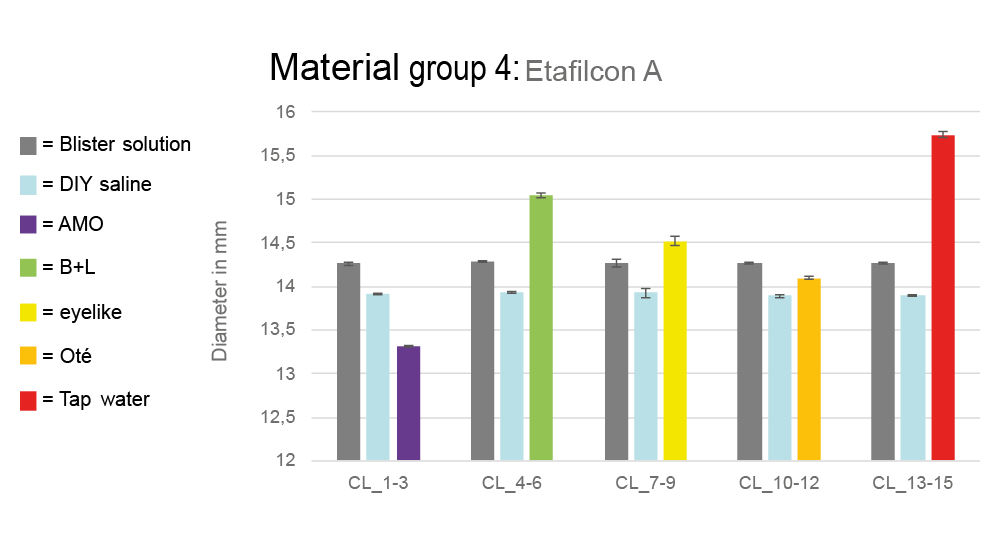
A key focus of the study was the change in lens diameters. Lenses from material group 4 (Etafilcon A) had values in the blister solution close to the manufacturer‘s specifications. After storage in the self-made saline solution, their diameter decreased and fell below the specified value. Particularly noteworthy were the changes in commercial solutions and tap water. For example, in AMO saline solution, the diameter decreased from 14.257 ± 0.016 mm (after removal from the blister) to 13.321 ± 0.009 mm. In contrast, in the Bausch + Lomb solution, the diameter increased from 14.286 ± 0.004 mm to 15.039 ± 0.026 mm. The most significant increase occurred in tap water, where the diameter increased from 14.270 ± 0.001 mm to 15.735 ± 0.034 mm. Figure 4 illustrates the mean diameters (material group 4) in the various solutions.


Lenses from groups 1, 2, 5A, 5B and 5C showed smaller changes. For instance, lenses from material group 1 (Polymacon) measured 14.038 ± 0.021 mm in the Bausch + Lomb solution, starting from 13.950 ± 0.011 mm in the blister. In tap water, the diameter increased to 14.061 ± 0.012 mm, from 13.938 ± 0.017 mm. Groups 2, 5A, 5B and 5C showed similarly minor changes, all within the ±0.2 mm tolerance according to DIN EN ISO 18369-216 and are therefore not graphically presented.
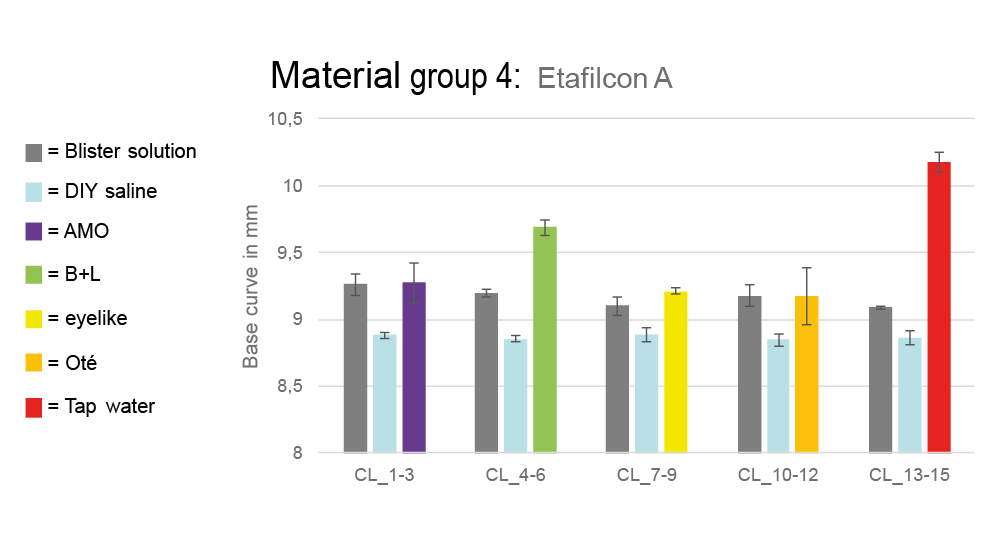
The base curves of all lens groups also changed depending on the storage solution. The deviations were most significant in material group 4. After storage in the self-prepared saline solution, the base curves were smaller than the manufacturer‘s values. In the commercial saline solutions from AMO, eyelike and Oté, the base curves returned to values similar to those in the blister. The largest increases were observed in the Bausch + Lomb solution with a base curve of 9.690 ± 0.056 mm (starting from 9.195 ± 0.028 mm after blister removal) and in the tap water with a value of 10.182 ± 0.075 mm (starting from 9.091 ± 0.012 mm after blister removal). For all other groups, changes were less pronounced. Figure 5 shows the change in base curves of material group 4 across all three measurements.
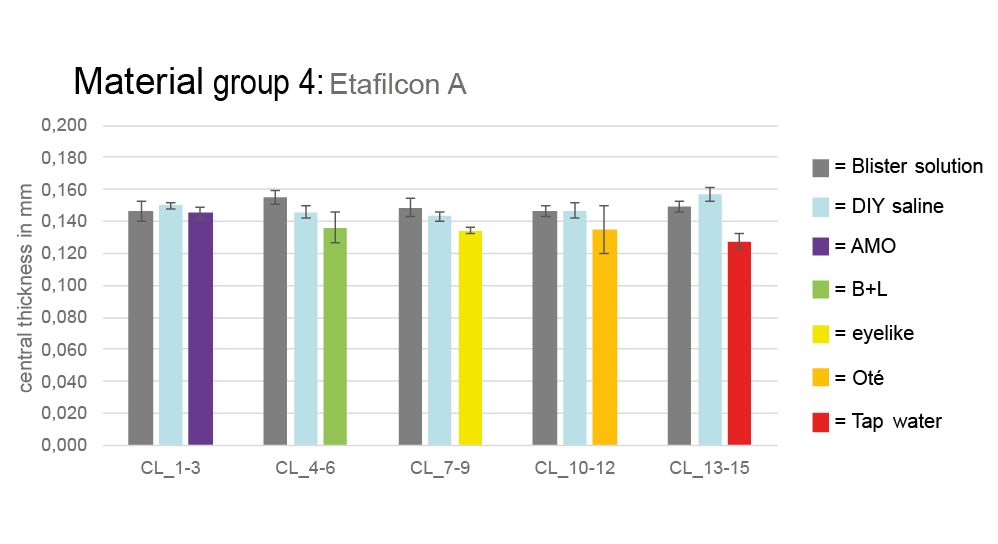
The central lens thickness varied slightly in different storage solutions. Lenses from material group 4 had thicknesses between 0.146 ± 0.007 mm and 0.149 ± 0.006 mm in blister solution. Similar values were observed after storage in the homemade solution. However, tap water caused a significant decrease to 0.127 ± 0.005 mm. Other material groups behaved similarly, with no clinically relevant deviations. Figure 6 shows the distribution of lens thickness (material group 4) across all measurements.
Additionally, the solid content of the solutions was analyzed. The Bausch + Lomb solution had the highest value at 1.95 %. AMO (1.42 %), eyelike GmbH (1.14 %) and Oté (1.22 %) showed lower solid contents.
Discussion
The pH measurements showed clinically relevant differences among the tested saline solutions. Most notably, Oté Pharma Sol B.V.’s solution had the lowest pH value (6.447), below the physiological range (7.2 to 7.6).17 Eyelike GmbH also had a low pH value (7.148), still below the physiological threshold. In contrast, the pH values of Bausch + Lomb, AMO and the homemade solution were all within the physiological range (Table 4). The differences may be due to the absence of buffering substances and preservatives in the Oté Pharma Sol B.V. solution. Tap water had the highest pH (8.367), likely due to local water composition. These findings support the assumption that pH can vary significantly between solutions.
Diameter measurements showed that especially lenses made from Etafilcon A (group 4) had significant changes. The most significant diameter increases occurred in Bausch + Lomb solution (+0.7 mm) and tap water (+1.4 mm), potentially due to increased osmolarity or high pH value. In other groups (1, 2, 5A, 5B, 5C), changes were not clinically relevant. For example, the change in diameter in material group 1 was only 0.084 mm, which is within the tolerance of ±0.2 mm in accordance with DIN EN ISO 18369-2.16 The unique properties of Etafilcon A, including the high water content and the ionic surface, appear to play a keye role here. The assumption that the diameter varies in a clinically relevant way in different solutions therefore only applies to contact lenses from material group 4.
Similarly, base curve measurements showed relevant changes for Etafilcon A lenses, with increases of 0.5 mm in Bausch + Lomb solution and over 1 mm in tap water. Other groups only showed variations within the tolerated range (±0.2 mm).16 This suggests that osmolarity and pH value of the solution can influence the base curve, but primarily in material group 4.
The central lens thickness was determined by OCT through front and back surface detection. A small reflection systematically overestimates values, but this affects all lenses equally, so comparability is maintained. No clinically relevant changes in lens thickness were observed (maximum change: 0.014 mm), contradicting the assumption that thickness would vary depending on solution. However, small sample sizes and measurement inaccuracies could have influenced results. Further studies with larger samples and improved technology are needed.
The results show that a higher pH value of the surrounding solution tends to correlate with an increased diameter and base curve of the Etafilcon A contact lenses. This was particularly observed in tap water, which had the highest pH value. However, no comparable changes were observed in the other material groups. This means that the sole influence of the pH value cannot be clearly confirmed, as the composition of the solutions could also play a role. Future studies should consider the influence of the pH value in isolation, in order to have a better understanding of the interactions.
Measurement procedures were influenced by several factors, including device handling, measurement uncertainties and the small sample size. Calibrating the OCT device and detecting certain lens materials proved to be challenging.
A sample size analysis showed that at least 40 lenses per material group are needed to improve the statistical validity of future results.
Further studies should also include precise ingredient information, which was often lacking in the commercial solutions. A more detailed chemical analysis, especially of osmolarity, would help clarify results. In addition, solutions from other manufacturers and other care products such as all-in-one or peroxide solutions could be investigated in order to obtain a more comprehensive picture of the interactions with contact lenses.
Conclusion
The present study demonstrates that saline solutions can influence the design parameters of soft contact lenses. In particular, contact lenses made from material group 4 showed the most significant changes in diameter and base curve across the various solutions. These findings highlight the importance of using only the solutions recommended by the manufacturer, as they are specifically formulated to match the material of the contact lens. This insight not only supports a more informed selection of care products but also encourages a more responsible approach to the use of solutions in contact lens care. Furthermore, the study shows that storing contact lenses in tap water should be avoided not only for hygienic reasons but also due to the shape changes observed, which can be caused by exposure to water.
Conflict of interest
The authors declare that there is no conflict of interests regarding the methods and devices mentioned in the article.
wasserhaerte. Referencing: 28 November 2023.
www.xylemanalytics.com/File%20Library/Resource%20Library/SIA/10%20Publications/SIA_pH-Fibel_Deutsch.pdf. Referencing:
30 November 2023.
