Prevalence of myopia in children and adults in Europe and North America
Purpose: The prevalence of myopia varies highly between different ethnic groups. Especially in East and Southeast Asia the prevalence of myopia is very high. In addition to ethnic factors, the prevalence of myopia is determined by genetic factors. The aim of the literature review is to determine the prevalence of myopia among children and adults of Caucasian origin in Europe and North America.
Material and Methods: A systematic literature review was performed for the prevalence of myopia in Europe, Middle East, North America, and Australia. For the evaluation of the results, the methodological requirements of an epidemiological study of myopia prevalence were formulated. A threshold of -0.50 D and retinoscopy should be standard.
Results: The prevalence of myopia is not increased among Caucasians with 30 % from a statistical point of view. In children, the prevalence of myopia can be assumed to be 15 %. The risk of myopia is increased threefold in children with myopic parents compared to children with nonmyopic parents. Refraction determination with autorefractometers and omission of cycloplegia leads to a significant overestimation of the prevalence of myopia.
Conclusion: An increase in myopia prevalence can not necessarily be inferred from the observed prevalence of 30% among Caucasians. A reliable determination of myopia prevalence requires standardized examination methods and thresholds for myopia.
Introduction
Uncorrected refractive errors are considered the most important cause of visual impairment according to the World Health Organization (WHO), and undercorrected myopia is the most common cause of visual impairment when visual acuity is taken as the basis.1 High myopia of more than -6.0 D carries an increased risk of pathological retinal changes such as myopic macular degeneration (MMD) or retinal detachments. The prevalence of myopia has been reported to increase for several years – also as a consequence of changing visual habits such as the increased use of digital devices. A prevalence of more than 50 % worldwide has been predicted for the year 2050.1 The renowned scientific journal “Nature” titled one of its issues “Myopia Boom”.2 Various risk factors are assumed for the development and progression of myopia. In addition to genetic factors, environmental factors are also considered potential risk factors. Obviously, myopia has become a problem especially in East and Southeast Asian countries. The number of people with myopia here is significantly higher than among Caucasians, for example. In individual regions of East Asia, the prevalence of myopia is 90 %, while worldwide about 30 % of all people are myopic.3 In countries such as the United States or the United Kingdom with a high proportion of residents whose ancestors immigrated from East or Southeast Asia, the proportion of myopes among people with Asian roots is significantly higher than that among the descendants of people with white skin colour (Caucasians).4,5 Australian children aged 11 to 15 years whose ancestors came from East Asia are eight times more likely to develop myopia than children of Caucasian ancestors.6 Ethnic factors play a major role as a risk factor for the development of myopia. The present study addresses the question of the prevalence of myopia among Caucasians in North America and Europe.
Methods
Ethnicities
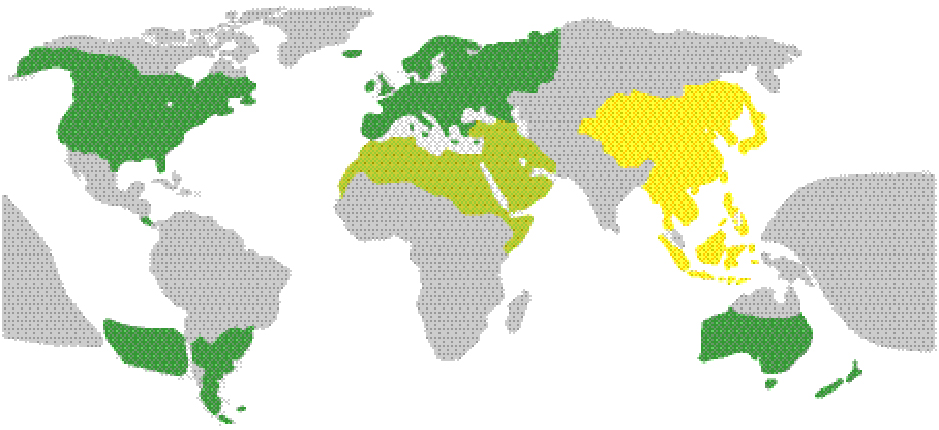
Ethnic factors appear to determine the development of some diseases. In North America, descendants of African ancestors have a significantly increased risk of glaucoma compared to Caucasians, while age-related macular degeneration occurs predominantly in descendants of European immigrants.7 In East and Southeast Asia, on the other hand, myopia plays a prominent role as a cause of severe visual impairment, including blindness.1 The three ethnic groups mentioned above are widespread in North America. Caucasians, simplified as “whites” in North America, include descendants from Europe, North Africa, and the Near and Middle East (see Figure 1). Some countries in South America (Chile, Argentina, Uruguay) as well as Australia and Oceania still have a very high proportion of descendants of European immigrants.
The population size of individual regions also influences the global prevalence of myopia. Asia was home to about 60 % of the world's population in mid-2020.8 About one-third of the world's population lives in the countries of East and Southeast Asia alone, which also have the highest myopia prevalence. Europe (9.7 %), North America (4.7 %), and Australia/ New Zealand (0.5 %) are home to about 15 % of the world’s population, with North America and Australia having a significantly higher proportion of the population of Asian origin than Europe. If the prevalence of myopia is expected to be 50 % worldwide in 2050, this is an average value that must consider the weighting of local prevalences with the respective population densities expected at that time. Asia's population is expected to increase more than Europe's.
Myopia definition
Standardized definitions of the variables and a consistent choice of thresholds are the basic requirements of evidence-based medicine. Comparability of myopia prevalence studies is limited without these prerequisites. The following are recommendations for myopia prevalence studies
- Physiologic myopia: a condition in which the spherical equivalent of one eye is ≤ -0.5 D when the accommodation of the eye is relaxed.
- High myopia: a condition in which the spherical equivalent of an eye is ≤ -6.0 D when the accommodation of the eye is relaxed.9
A further classification of physiologic myopias is according to the following categories
- Low myopia: ≤ -0.5 to ≤ -3.0 D
- Moderate myopia: < -3.0 D to ≤ -6.0 D
- High myopia: < -6.0 D
possible. If the progression of myopia development in children is to be considered, the definition of premyopia may be useful. This is defined as a distance refraction between +0.75 D and -0.50 D in a preschool-aged child. In the presence of premyopia, the probability of developing myopia in the future is significantly increased.9 From the aspect of myopia onset, school myopia and adult onset myopia can be defined. The former is present when the onset of myopia is in childhood. Myopia onset after the age of 14 is considered late onset myopia.
If imaging and depth of field are considered, the myopia definition AR< 0 D makes no sense for physiological optical reasons. Increasingly, a far point refraction of -0.5 D is becoming accepted as the threshold for myopia. A meta analysis of 138 myopia studies found that 87.7 % of all studies used a threshold of < -0.50 D or ≤ -0.5 D.9 However, a threshold of 0 D is frequently used, particularly in older studies, making comparison with more recent studies difficult.
A myopia prevalence study provides meaningful results only if the proportion of males and females studied corresponds to the actual ratio of males to females in the age group of the total population considered. Women are more likely to have myopia than men. Studies in which more women than men have been examined carry the risk of overestimating myopia prevalence. Without information on the age structure of the participants in a study, comparisons with other studies are limited because the prevalence of myopia is age-dependent.
Refraction methods
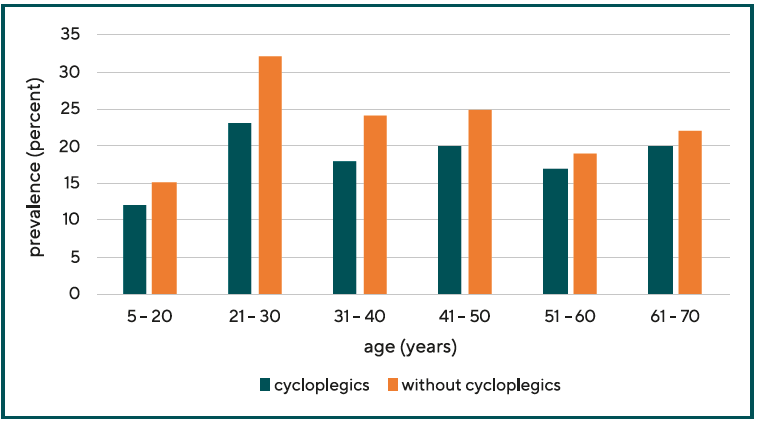
The determination of the far point refraction should preferably be performed by means of retinoscopy with cycloplegics. Relaxation of accommodation ensures that accommodation- related myopia or myopization is not counted as myopia, which would lead to a distortion of the number of myopia and the degree of myopia. Studies in which the prevalence of myopes was determined without the use of cycloplegics showed an odds ratio for myopia that was a factor of 2 higher than studies in which cycloplegics were used. Not using cycloplegics leads to overdiagnosis of myopia.10 When cycloplegics are used, the prevalence of myopia in 20- to 50-year-olds is up to 7 % lower compared with the prevalence of myopia determined without cycloplegics (see Figure 2). In older people who are no longer capable of accommodation, the two prevalences do not differ significantly.11
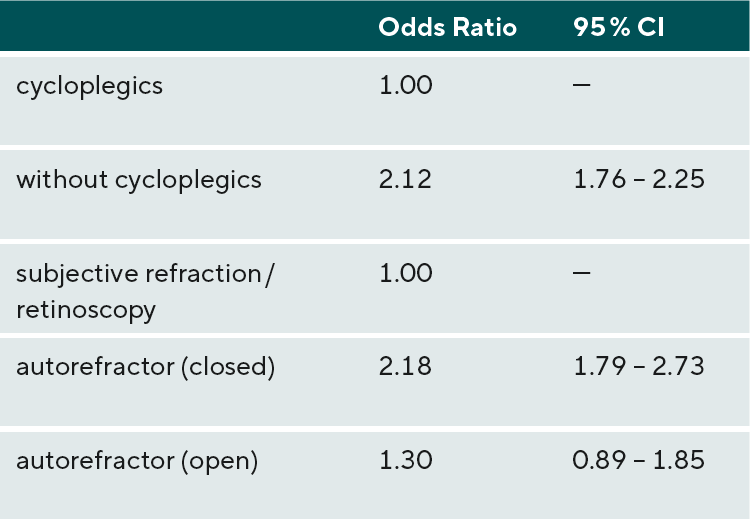
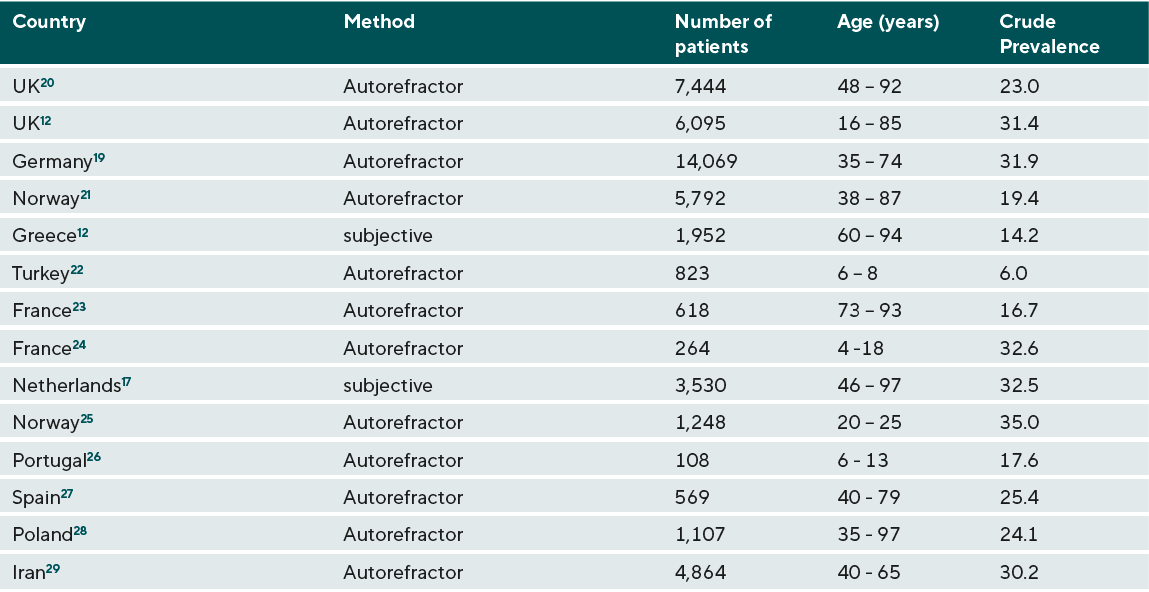
Furthermore, the prevalence of myopia also depends on the refraction methods used. Studies based on autorefractometers found higher myopia prevalences compared to studies using subjective refraction determination or retinoscopy. 5 The difference was particularly large when closed autorefractometers were used (see Table 1).
Myopia should never be determined based on a questionnaire or determination of the power of spectacle lenses with a vertex focimeter. Questionnaires for children are most often filled out by their parents. They usually do not have the necessary knowledge to determine the refractive error accurately. If the refractive error is determined as the result of the measurement with a focimeter, it cannot be assumed that the existing vertex refraction powers of the spectacle lenses correspond to the actual values of the refractive error.
Pool prevalences
The E³ Consortium prevalence study reports a prevalence of 30.6 % for the population of Europe.12 The study evaluated the far point refractions of 61,946 individuals, of whom 15,845 were myopic. This results in a proportion of 25.6 %. This is the crude prevalence. The result of this meta-study is a pooled prevalence, i.e. the results of several sub-studies were analysed. The age structures of the sub-studies were not identical, which is why the results had to be adjusted. Considering the different age structures, the age-adjusted prevalence is 30.6 %, which differs from the raw prevalence. When analysing epidemiological studies on the prevalence of abnormalities, it is important to consider whether age adjustment of the raw data has been performed.
Results
Myopia prevalence among adults
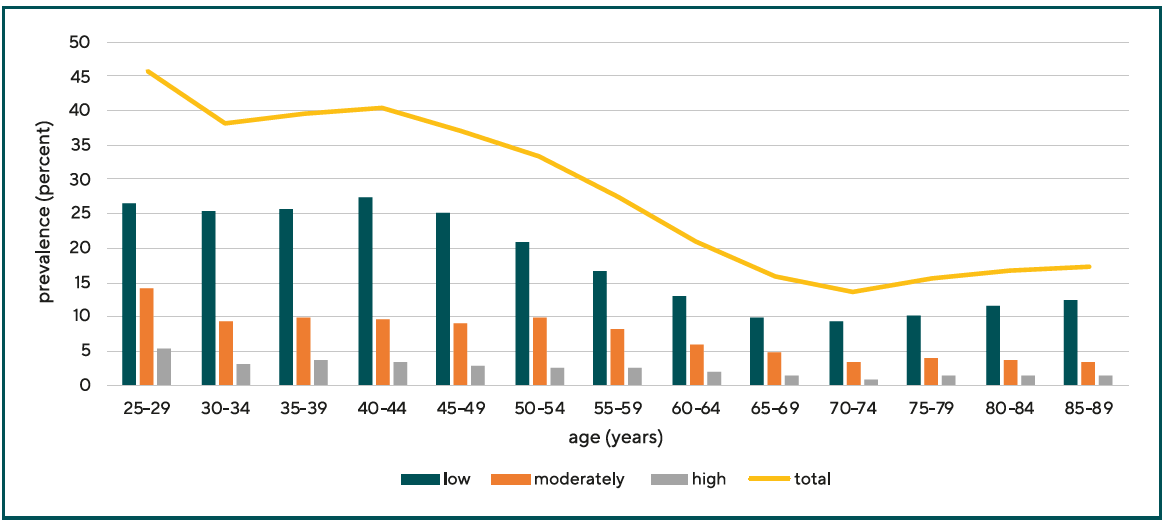
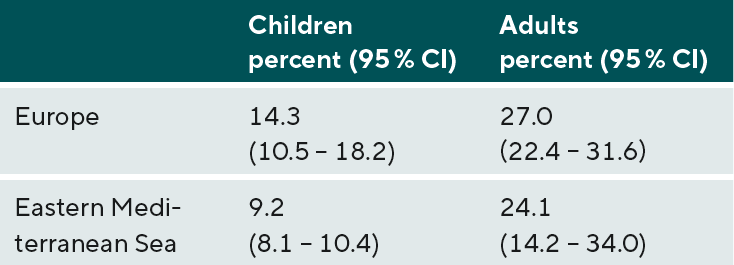
One quarter to one third of adult Caucasians in Europe, North America, the Middle East, and Australia and Oceania are myopic. About 15 percent of children in Europe are considered myopic.13 The results of all the studies on which these figures are based depend on the age structure of the patients studied, in addition to the thresholds and refractive procedures already discussed. Younger patients show a higher myopia prevalence than older patients (see Figure 3).
Myopia prevalence data published in 2004 by the Eye Diseases Prevalence Research Group showed a myopia prevalence of 26.6 % for Europe (Table 2). A prevalence of 25.4 % was reported for North America and a prevalence of 16.4 % was reported for Australia.14 This study incorporated the results of the Beaver Dam Eye Study15, the Blue Mountains Eye Study16, and the Rotterdam Study17, among others. A total of 29,281 subjects were included in this study. A value of -1.0 D was taken as the threshold, which is why the prevalences determined in this study are somewhat lower than in other studies with a threshold of -0.5 D or -0.75 D.
The NHANES study conducted in the United States from 1999 to 2004 found a prevalence of 35.1 % for men aged 20 to 39 years. The prevalence of myopia in women was significantly higher at 42.3 % in this study. In those over 60 years of age, the NHANES study reported a prevalence of 23.1 % for men and 18.6 % for women.18 In studies conducted in the United States, the composition of study participants is significantly more heterogeneous than in European studies. Asians, African Americans, and Hispanics contribute to myopia prevalence to varying degrees due to their different ethnicities.
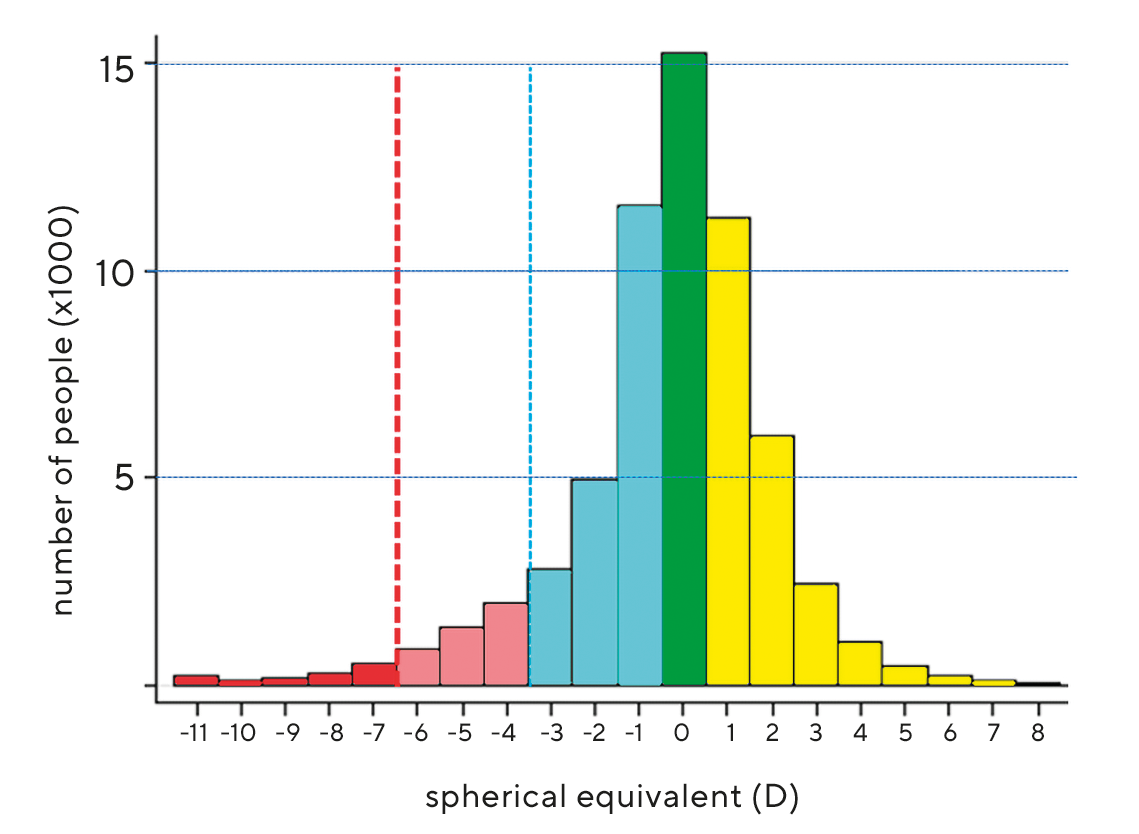
A meta-analysis of 15 studies on the prevalence of refractive error in Europe by the European Eye Epidemiology (E³) Consortium, which analysed data from a total of 61,946 study participants, found a prevalence of myopia of 30.65 % (95 % CI 30.4 to 30.9).12 For high myopia, the prevalence was 2.7 % (95 % CI 2.69 to 2.73). The threshold was assumed to be ≤ -0.75 D (corresponding to < -0.50 D). 98 % of all study participants were Caucasian. The results of both objective (autorefractometer) and subjective refraction determination were evaluated. The age of the study participants ranged from 25 to 90 years. The proportion of women among the study participants was 57.6 %. Figure 4 shows the distribution of all far point refractions in an interval from -11 D to +9 D. The maximum of the distribution is at a value of +0.56 D. The distribution curve shows a leptokurtic course, i.e. the edges of the curve are strongly flattened. More than two thirds of all far point refractions lie in an interval of -1 D to +1 D. The shape of the distribution curve does not correspond exactly to a Gaussian distribution (normal distribution) but is approximated by a Laplace distribution. Within the regions of Europe (North, West, South) there were no differences regarding myopia prevalence (Table 3).
The Gutenberg study with 13,959 study participants found a prevalence of myopia in Germany of 35.1 %.19 Myopia was considered to exist if the distance refraction was less than -0.50 D. The authors noted that this value was higher than in other myopia prevalence studies. The refraction determinations were performed without cycloplegia using an autorefractometer (Humphrey HARK 599), which would at least partially explain the increased prevalence.
Myopia prevalence among children
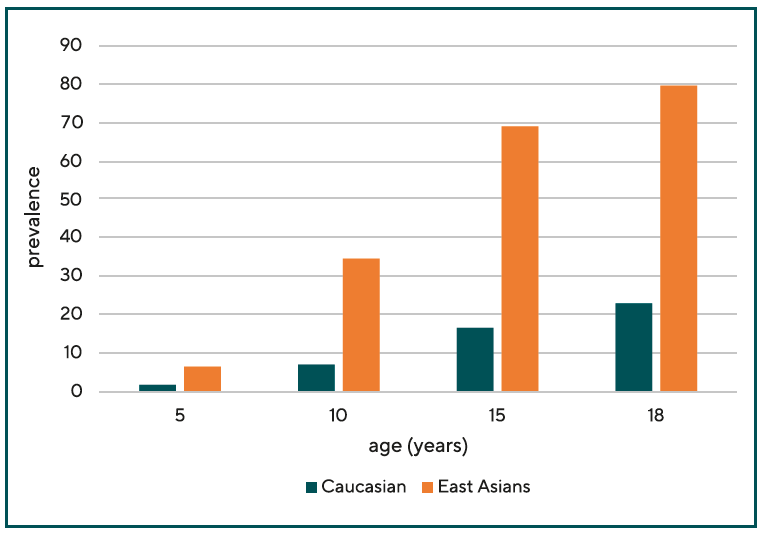
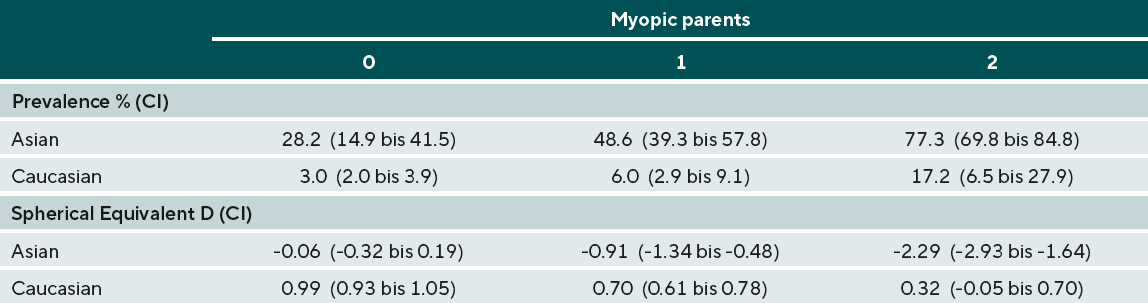
Myopia develops from preschool age, before which almost all children are hyperopic. The earlier myopia onset, the higher the expected final refraction. Children of Caucasian descent are significantly less affected by myopia than children with East Asian roots. Myopia also progresses more rapidly in Asian children than in white children. Figure 5 shows the comparison of myopia prevalences in Caucasian children and adolescents aged 5 to 18 years. At age 10, myopia is four times higher among Asian children than among Caucasian children.5
A study of 10- and 11-year-old school children in the United Kingdom showed a myopia prevalence of 3.4 % among white European children, 10 % among children of Afro-Caribbean origin, and 25.2 % among children of South Asian origin. The authors attributed the cause to their greater axial eye lengths compared with white children. The eyes of South Asian children in this study were 0.44 mm (95 % CI 0.30 to 0.57 mm) longer than those of white children. Afro Caribbean children’s eyes were a mean of 0.30 mm longer (95 % CI 0.16 to 0.44 mm)4.
An Australian study investigated the incidence of myopia among 2353 children aged 12.7 ± 0.4 years. The aim was to clarify the extent to which genetic and ethnic factors as well as near work influence the development of myopia. The odds ratio of children doing a lot of near work was not significantly increased (OR = 1.01; 95 % CI 0.99 to 1.03). Genetic factors, on the other hand, played a greater role. Myopia prevalence in children of all ethnicities increased with the number of myopic parents. It was 7.6 %; 14.9 %; and 43.6 % when none, one, or both parents were myopic. Children of East Asian origin had higher myopia and greater eye length than non- Asian children30 (Table 4).
The myopia prevalence of children of predominantly Caucasian origin in South America does not appear to differ significantly from the myopia prevalence of Caucasian children in other areas of the world. In Santiago de Chile, a prevalence of 3.4 % was found in 5-year-olds. This increased to values of 14.7 % in 15-year-old girls and 19.4 % in 15-yearold boys.31
The prevalence of myopia among 823 Turkish school children (6.7 years ± 2.2 years) was 6.0 %, the same level as among other Caucasians. Lower prevalences were found among children from rural areas.22 Similar values were also found in the Middle East, which is also included in the Caucasian population (see Figure 1). 3.5 % of boys and 4.2 of girls younger than 15 years were found to be myopic.32 In Portugal, a myopia prevalence of 17.6 % was found in children aged 6 to 13 years.26
Myopia prevalence shows significant differences between boys and girls. From the age of 9 years, different prevalences of boys and girls can be demonstrated. At age 18, girls are twice as likely as boys to have myopia. The odds ratio is 2.03 (95 % CI 1.40 to 2.93).5
Discussion
Among adults of Caucasian origin, the prevalence of myopia is estimated to be about 30 % worldwide, with young adults being more likely to be myopic than adults older than 50 years. The main reason for this age difference in myopia prevalence is likely to be age-related changes in the lens of the eye. Due to changes in the lens proteins, the lens refractive power decreases, resulting in hyperopia of the eye (“hyperopia of the age”). The prevalence of myopia in preschool children is about 5 % in almost all studies. It increases during the growth processes of the eye to values of about 15 % at the age of 15 years.
Ethnic factors determine the prevalence of myopia. Geographic location, on the other hand, does not appear to influence myopia prevalence. Caucasians in Europe, the Middle East the United States, or Australia/New Zealand are almost equally likely to develop myopia.5
Among Australian children and adolescents, children of Asian ancestry are more likely to be myopic than those of European ancestry.30,33 This is thought to be due not only to genetic factors but also to differences in lifestyle. Accordingly, Asian children spend up to 7 hours less per week outdoors than Caucasian children.33 A dependence of ethnicity on myopia prevalence has also been observed in the USA. US Americans of Asian descent are more likely to be myopic than Caucasians. In contrast, the myopia prevalence of African Americans is lower than that of Caucasians.34 The proportion of non-Caucasians in Europe is comparatively low compared to North America and Australia, and therefore the population structure is more homogeneous than in North America or Australia. Therefore, no bias in myopia prevalence due to different ethnicities is expected.
In addition to ethnic factors, a genetic component to the prevalence of myopia can also be assumed.
The risk of myopia in a child in whom both parents are myopic is threefold higher than in a child whose parents are not myopic.6,30,35 The inheritance of far point refraction is based on polygenic inheritance. This means that the developing eye is better able to adapt to changing environmental conditions. The extent to which changing visual habits, i.e., especially the increased use of digital devices by children and adolescents, affect myopiaprevalence requires more detailed analysis.
The evaluation of myopia prevalence studies is complicated by the inconsistency of threshold, measurement methods used, and the inconsistent use of cycloplegics. Cycloplegics are rarely used in epidemiologic studies of myopia prevalence, so overestimation of myopia prevalence cannot be ruled out. The prevalence can thus be overestimated by up to 7 percentage points in under-50-year-olds.11 Autorefractometers, which are used much more frequently than retinoscopy in epidemiological studies, can also lead to an overestimation of myopia prevalence because of instrumental myopia, which cannot always be excluded.
In the present work, the myopia boom was not discussed because the existence of this boom is not considered certain specifically for Caucasians. Vitale et al, from whose study this boom was inferred, do say that when compared to a study conducted 20 years earlier, the number of myopias is higher, but that an increase in myopia prevalence cannot be inferred because of the serious methodological differences between the studies.18 The authors do not conclude a myopia boom or a myopia pandemic; they merely assume the possibility of an increase in myopia prevalence.
Conclusions
The onset and development of myopia are very much determined by ethnic factors. Among Caucasians, the prevalence of myopia is not increased with about 30 % from a statistical point of view. For children and adolescents, a myopia prevalence of about 5 % and 15 %, respectively, is assumed. Since almost all epidemiological studies on myopia prevalence have used autorefractometers without cycloplegics to determine refraction, an overestimation of the actual myopia prevalence cannot be excluded. When assessing the predicted myopia prevalence in 2050, ethnic factors must be weighted more strongly than is currently the case.

About Andreas Berke
Dr. rer. nat. -
Andreas Berke has been Director of the Cologne School of Optometry since 2015 and is a member of the ECOO Board of Qualification.
COE Multiple-Choice-Questionnaire
The publication "Prevalence of myopia in children and adults in Europe and North America" has been approved as a COE continuing education article by the German Quality Association for Optometric Services (GOL). The deadline to answer the questions is September 1 2022, and only one answer per question is correct. Successful completion requires answering four of the six questions.
You can take the continuing education exam while logged in.
Users who are not yet logged in can register for ocl-online free of charge here.