Review of the tear film measurements of a multifunctional instrument
Purpose: The aim of this study was to test the measurements of the tear film stability and tear meniscus height of the Visionix 120+ (VX; Luneau Technology, Jerusalem, Israel).
Material and Methods: In 24 volunteers (mean age = 37.42 ± 14.23 (standard deviation)), the tear film stability (V-NIBUT and V-NIBUT M) and the tear meniscus height (V-TMH) were determined with VX and the gold-standard, the “Tearscope” technique, of the right eyes (control; NIBUT and TMH). The symptoms were observed using the Ocular Disease Index-6 (OSDI-6). The methods were analysed with Cohen’s Kappa and intra-class correlation (ICC), the prediction probability with the Receiver-Operator-Characteristic-Curve (ROC).
Results: The average OSDI-6 grade was 8.00 ± 5.75, the average tear film stability, measured with the VX, was 3.92 s ± 1.79 (V-NIBUT) and 7.36 s ± 1.67 (V-NIBUT M), the control was 10.57 s ± 6.84. The mean tear meniscus height, measured with the VX, was 0.31 mm ± 0.10, the control 0.31 mm ± 0.11. The Cohen’s Kappa analysis showed none to slight agreement between methods (V-NIBUT – NIBUT: Kappa -0.005, p = 0.708; V-NIBUT M – NIBUT: Kappa 0.035, p = 0.032; V-TMH – TMH: Kappa 0.06, p = 0.051). V-NIBUT to NIBUT gave an ICC of 0.167 (p = 0.332), V-NIBUT M to NIBUT gave 0.296 (p = 0,203) and V-TMH to TMH -0.192 (p = 0.661). While NIBUT was a significant discriminator of OSDI-6, this was not the case with V-NIBUT or V-NIBUT M (NIBUT: area under the ROC (AUC) = 0.832, p = 0.009; V-NIBUT: AUC = 0.547; p = 0.145; V-NIBUT M: AUC = 0.668, p = 0.127).
Conclusion: The measurements of the VX differed significantly from the control measurements.
Introduction
Dry eyes are one of the most common reasons why patients ask to see an eye specialist.1 The main criterion in the definition of dry eyes is the homeostasis of the tear film.1 In 2017, a possible workflow for diagnosing dry eyes was presented in the Tear Film Ocular Surface Society Dry Eye Workshop II (TFOS DEWS II).2 The method stipulates that the homeostasis markers,2 tear film stability, osmolarity of the tear film and staining of the ocular surface are assessed in addition to screening using the Ocular Surface Disease Index (OSDI) or the Dry Eye Questionnaire-5 (DEQ-5). The TFOS DEWS II report clearly emphasises the importance of a non-invasive observation technique when assessing the tear film stability.
The classic, non-invasive observation technique to determine the tear film stability is the Tearscopse (Keeler Ltd., UK) or, since it is no longer produced, one of its succesors, such as the Polaris (bon optic Vertriebsges.mbH, Lübeck, Germany).2-6 Like the original Tearscope, these are special cold light sources that are used in conjunction with the slit lamp microscope. A grid foil can be used to determine the non-invasive tear breakup time (NIBUT), whereby grid lines or placido rings are projected onto the ocular surface. In recent years this idea has been taken up by different measuring instruments and, for example, video topographers have been equipped with the appropriate software with which the tear film stability can be measured completely automatically based on the distortion of the placido image during the thinning of the tear film.6-12
The multifunctional instrument “Visionix 110“ from Visionix (Luneau Technology, Jerusalem, Israel) has been enhanced with a dry eye function (Visionix 120+ (hereinafter abbreviated as “VX“)). Contrary to other instruments, such as the Keratograph 5M (Oculus Optikgeräte GmbH, Wetzlar, Germany), on which there are numerous publications 6,8-10, to the best of the author‘s knowledge, the dry eye module of the VX has not yet been investigated in an independent study. The aim of this study was, thus, to review the two functions to measure tear film stability and tear meniscus height in a pilot study.
Methods
Both the tear film stability and the tear meniscus height were measured with the VX and the Polaris (bon optic Vertriebsges.mbH) on the right eye of 24 test subjects (19 women, 5 men; mean age (years) = 37.42 ± 14.23 (standard deviation)). Additionally, the dry eye symptoms of the test subjects were queried using the OSDI-6.
Fully automatic measurement with VX
The VX was used according to the manufacturer‘s instructions: the test subject was asked to position themselves on a chin rest and the Dry Eye module was started. The sequence of measurements is fully automated. First, the tear film stability was determined after the test subject had blinked twice. This measurement was based on the first tear breakup time (= V-NIBUT). Then, the value “breakage time Av.“ (V-NIBUT M), which is not defined more precisely by Visionix, was established. Following this procedure, an image of the tear meniscus was automatically recorded and the height of the tear meniscus was measured manually on the screen of the instrument (V-TMH).
Control measurement
The control measurements (= control group) took place with an interval of at least 30 minutes and at a maximum of 60 minutes before or after the VX measurement. When using the Polaris (with a fine grid) on the slit lamp microscope, the tear meniscus was photographed and the tear film stability was subsequently captured with a video recording. When observing the tear film stability, the test subject was asked to blink twice and then keep the eye open for as long as possible. The time between the last blink of the eye and the first “tear breakup“ was later retrieved from the video sequence. After all the examinations had been completed, the height of each tear meniscus was measured with the software included in the slit lamp microscope (Phoenix, bon optic) using the images of the tear meniscus. The median of the three consecutive examinations was noted for both values: the non-invasive tear breakup time (NIBUT) and the tear meniscus height (TMH).
Symptoms
An interview using the OSDI-6 13 questionnaire was conducted between the two examinations to determine the dry eye symptomatic status. The test subjects were grouped into “normal“ and “symptomatic“ depending on whether their score was lower or higher than 4.
Randomisation and masking
In order to rule out a possible effect due to the various examination techniques, the order of the measurements (VX and control measurement) was randomly allocated so that half of the test subjects were examined first with the VX, while the other half underwent first a control measurement. The experts conducting the measurements were masked from the previous examinations and evaluations, the test subjects were masked from all results. The study followed the Helsinki Declaration,14 all test subjects signed a corresponding declaration of consent before starting the study, and the project was examined by the Ethics Committee of the Aston University.
Statistical Analysis
The variables were checked for normal distribution using the Shapiro-Wilk test. The concordance of the methods (Visionix-120+ measurements versus control measurements) was analysed using Cohen‘s Kappa and the intra-class correlation (ICC). The 95 % limits of agreement (LoA) are shown in Bland-Altman diagrams. The probability of the variables V-NIBUT, V-NIBUT M and NIBUT being able to predict dry eye are shown using the receiver operating characteristic curve (ROC curve). All data were analysed with the software IBM SPSS Statistics for Windows (Version 25.0. Armonk, NY, USA: IBM Corp.). The number of test subjects was determined by means of a power analysis with regard to the variable “tear film stability“ based on values from a previous study15 (1 - β = 0.800; G*Power 3.1.9.2).
Results
The mean OSDI-6 score of the test subjects was 8.00 with a standard deviation (SD) of ± 5.75. 8 test subjects showed OSDI-6 scores below the limit value, 16 were symptomatic. The mean tear film stability measured with the VX was 3.92 ± 1.79 s (V-NIBUT) and 7.36 ± 1.67 s (V-NIBUT M), the control measurement was 10.57 ± 6.84 s. The mean tear meniscus height measured with the VX was 0.31 ± 0.10 mm, whereas the control measurement was 0.31 ± 0.11 mm. Cohen‘s Kappa analysis showed no agreement between the V-NIBUT values and the control measurement NIBUT (Kappa -0.005, p = 0.708) and V-NIBUT M displayed no or little agreement with NIBUT (Kappa 0.035, p = 0.032; [Cohen suggested interpreting the kappa result as follows: values ≤ 0 as indicating no agreement and 0.01 – 0.20 as none to slight, 0.21 – 0.40 as fair, 0.41 – 0.60 as moderate, 0.61 – 0.80 as substantial, and 0.81 – 1.00 as almost perfect agreement]16).
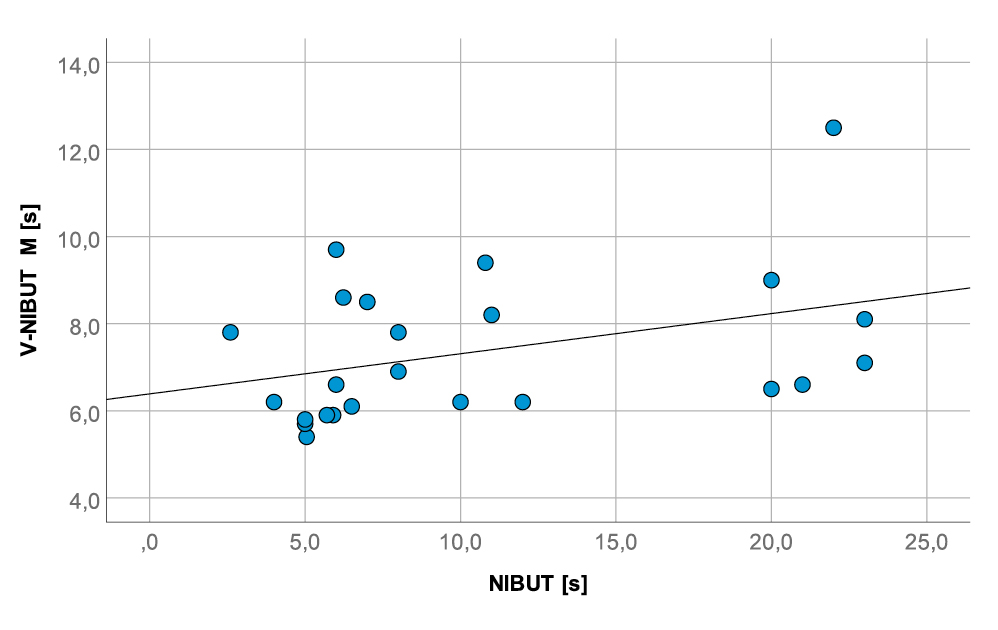
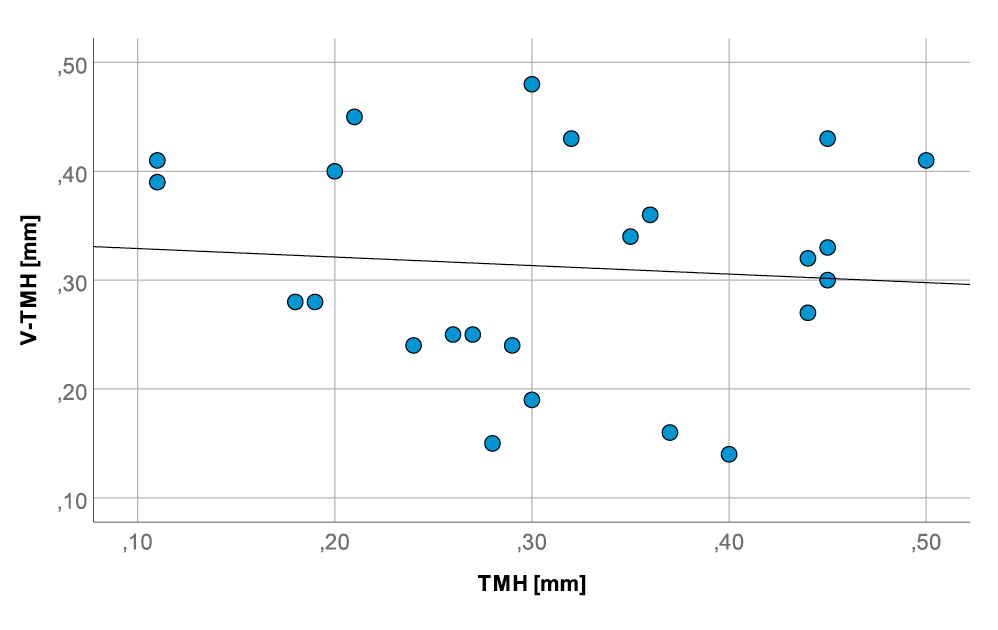
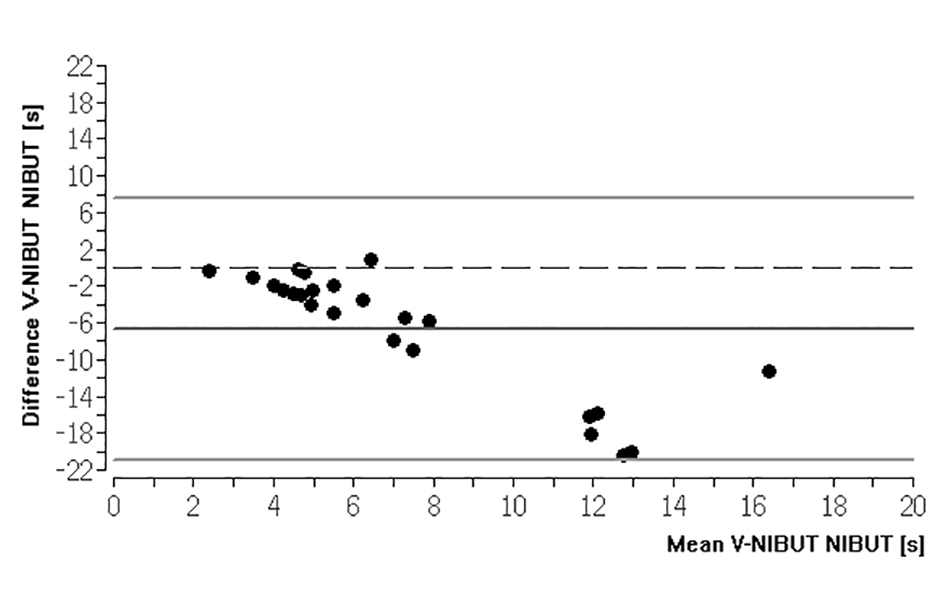
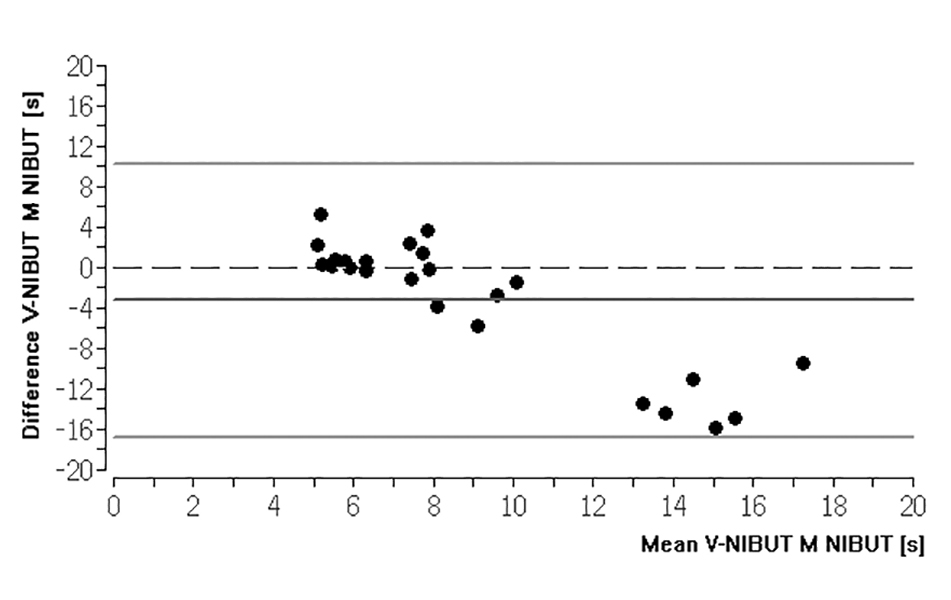
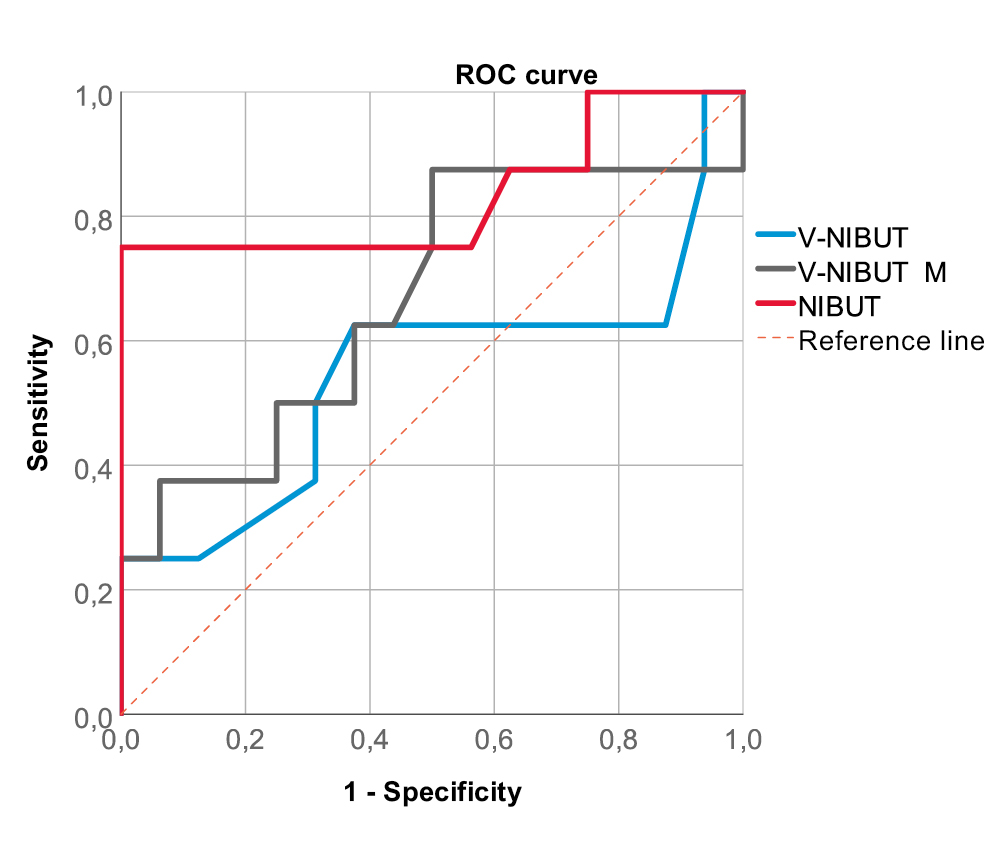
There was also no agreement between the V-TMH and the TMH of the control measurement (Kappa 0.06, p = 0.051). This was also verified by the ICC calculation (Fig. 1 and Fig. 2). V-NIBUT to NIBUT gave an ICC of 0.167 (p = 0.332), whereas V-NIBUT M to NIBUT gave an ICC of 0.296 (p = 0.203) and V-TMH to TMH an ICC of -0.192 (p = 0.661). The 95 % LoA for V-NIBUT to NIBUT were -20.89 s and 7.58 s, for V-NIBUT M to NIBUT -16.73 s and 10.30 s, and for V-TMH to TMH -0.33 mm and 0.33 mm (Figs. 3, 4 and 5). The post-hoc power analysis for the differences between V-NIBUT and NIBUT as well as for those between V-NIBUT M and NIBUT resulted in a 1-β of 1.00. NIBUT showed (Fig. 6) a high probability of predicting the OSDI-6 diagnosis with an area under the ROC curve (AUC) of 0.832 (p = 0.009), while neither V-NIBUT nor V-NIBUT M were able to distinguish between the OSDI-6 diagnoses “normal“ and “symptomatic“ (V-NIBUT: AUC = 0.547; p = 0.145; V-NIBUT M: AUC = 0.668, p = 0.127).
Discussion
The assessment of the tear film stability serves the general dry eye diagnosis, whereas the measurement of the height of the tear meniscus is a special test to diagnose the aqueous deficient dry eye.2 Numerous studies show a clear connection between NIBUT and dry eye symptoms.2,9,17,18 Accordingly, in this study, NIBUT also showed a high probability of predicting OSDI-6, something which was not shown by V-NIBUT or V-NIBUT M. The control measurement TMH was used to check the correctness of the tear meniscus measurement of the VX (V-TMH). When using the Polaris, the ROC analysis showed that the measurement of the tear film stability has a high probability of predicting the OSDI-6 diagnosis and, thus, dry eye. This was not the case with the measurements with the VX. Based on the results of this study, it can be concluded that the VX is not suitable as a screening device for the detection of dry eye symptoms. The method comparison showed none to slight agreement between the control measurements and the measurements of the VX; as a result, it must also be questioned whether this device is capable of reliably determining this variable. The applied technique of the control measurements is often seen as the “gold standard“ in scientific work and has been used for years.3,4,6,9,19-23 So, the conclusion that this is a device-specific problem of the VX is solid.
Possible causes for the significantly different measurements of the tear meniscus height of the VX compared to the control measurements can be, on the one hand, the measurement sequence and, on the other, the image quality of the recording of the tear meniscus, which then has to be measured on a very small touchscreen. In contrast, TMH could be evaluated very precisely on a high-resolution, zoomable image on a 22‘‘ screen with the Phoenix software. Since stimulating secretion cannot be ruled out when the tear film breaks up, the tear meniscus was first photographed for the control measurements and then the tear film stability was recorded.25 The evaluation of the exact tear breakup time was conducted on the screen. Both the VX and the control measurements are subjective measurements of TMH; the tear film stability is measured objectively with the VX (automatically detected) but again subjectively with the Polaris. With the VX, this is the other way around and automatically specified. Thus, the measurements of the tear meniscus height could have been falsified by a possible secretion stimulation. During the control measurements, the tear meniscus was illuminated with the Polaris, which means that it appears white, and the upper and lower limits can then be more clearly identified in the digital measurement. With the VX, the tear meniscus is photographed with normal lighting, so it can be assumed that the respective upper and lower limits of the tear meniscus were more difficult to see. Many practitioners who observe the tear meniscus with a slit lamp microscope are certainly familiar with this problem. Since it is transparent, it is not always easy to detect its upper and lower limits.
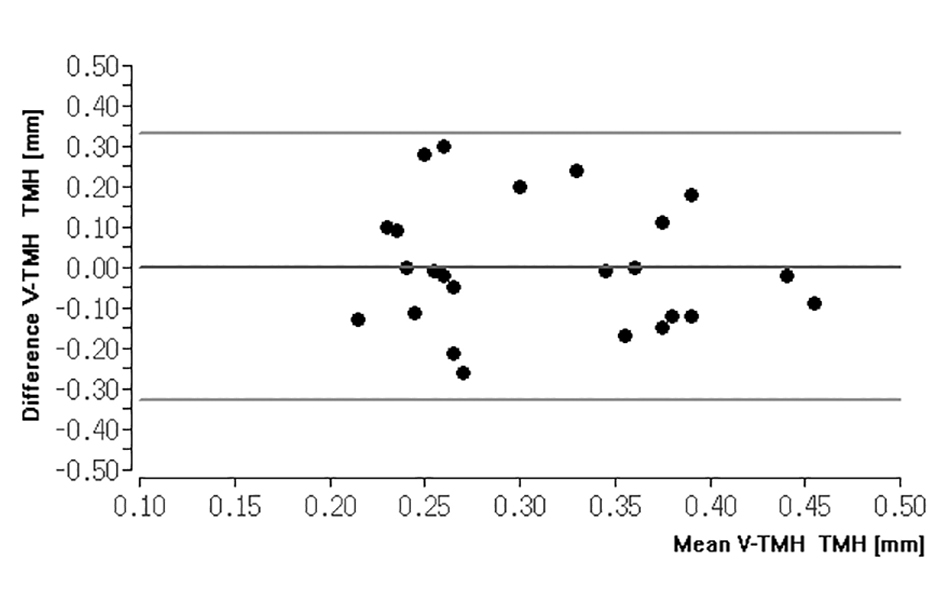
However, while the control measurement technique used can diagnose aqueous deficient dry eye,2 this does not seem possible using the VX. Although the average value of all measurements of the tear meniscus height with the VX does not differ from the mean value of all control measurements (0.31 ± 0.10 mm versus 0.31 ± 0.11 mm), this does not mean that the measurements are the same for each test subject (Fig. 2). The same was revealed through the method comparison, in which V-TMH showed no agreement with TMH. The Dry Eye Module of the VX has additional functions, such as the classification of ocular redness and the assessment of blepharitis and meibomian gland dysfunction. The recorded color image of the patient‘s eye can be compared with a stored classification key. To the best of the author‘s knowledge, this classification key appears to be the Efron Grading Scale.26 Since there are already numerous studies on this classification key as well as other traditional classification keys, this study concentrated on the device’s measurement options of the tear film. However, it is questionable whether a dysfunction of the meibomian glands, as advertised by the manufacturer, can be identified. For example, the TFOS DEWS II Report and the “International Workshop on Meibomian Gland Dysfunction“ recommend a more detailed approach than what is possible with the VX.2,27
Even if the number of test subjects is based on a power analysis, it would be interesting to check the results of this study in a larger population. It would also be interesting to check the repeatability of the measurements. Such studies exist for the control measurements as well as for some of the established multifunctional instruments,6,5 but not for the VX. Nevertheless, it seems to make more sense to first of all optimise the VX to obtain meaningful results in the assessment of the tear film. When measuring the tear film stability, for example, fundamental errors can be seen: movements of the tear film after blinking are often evaluated as tear film break-ups. However, it is known that it often takes a few seconds for the tear film to build up or evenly spread over the ocular surface after blinking.28 According to the author, the VX detects this in many cases as a thinning of the tear film and thus as a V-NIBUT value. This seems to be confirmed by the considerably shorter V-NIBUT times compared to the control measurements. As already discussed, a further consideration is the order in which the measurements are performed.
Conclusions
The measurements of the Visionix 120+ differed significantly from the control measurements. NIBUT was a significant disciminator of symptomatic dry eye and normal, evaluated by the OSDI-6, but not V-NIBUT or V-NIBUT M. For this reason, it seems questionable to use the Visionix 120+ as a screening instrument for dry eyes.
Conflict of interest
The author has no conflict of interest with regard to the methods and devices mentioned in the article.

About Heiko Pult
Prof. Ph.D. - Dr. Heiko Pult – Optometry & Vision Research, Weinheim, Germany, School of Biomedical & Life Sciences, Cardiff University, Cardiff, UK, Ophthalmic Research Group, College of Health and Life Sciences, Aston University, Birmingham, UK
Heiko Pult is an optometrist with over 25 years of experience in clinical practice as well as in clinical science. Since 1998 he is managing director of 'Horst Riede GmbH' in Weinheim.
Multiple Choice Questionnaire
The publication "Review of the tear film measurements of a multifunctional instrument" has been approved as a COE continuing education article by the German Quality Association for Optometric Services (GOL). The deadline to answer the questions is 1 March 2023. Only one answer per question is correct.
Successful completion requires answering four of the six questions.
You can take the continuing education exam while logged in. Users who are not yet logged in can register for ocl-online free of charge here.