Target-specific Differences in the Measurement of Accommodative Response
Purpose: Previous studies report conflicting results regarding the influence of different optotypes on accommodative response (AR). The aim of this study was to determine whether the type and size of the optotype influence AR.
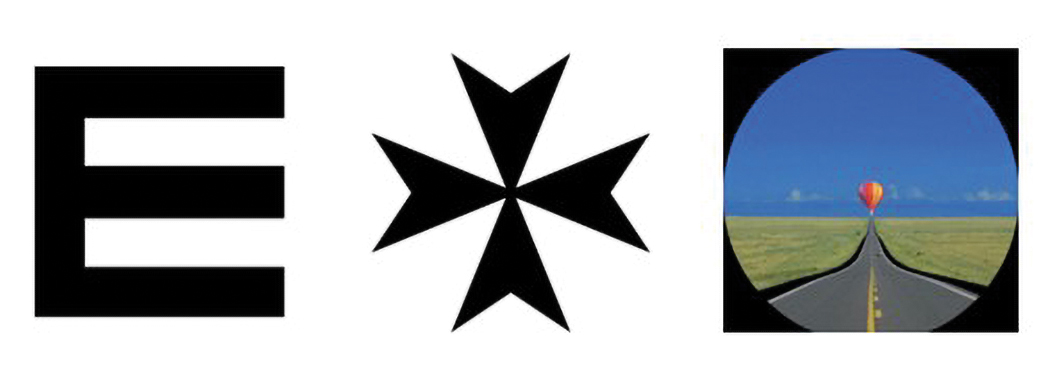
Material and Methods: 51 students (20-39 years) were included. Each participant was tested 18 times with six different optotypes. A modified open-field autorefractor (WAM-5500, Grand Seiko, Hiroshima, Japan) was used and measurements were performed monocularly under binocular conditions at a distance of 33 cm. The targets were limited due to its purpose and consisted of the letter “E” in three different sizes, the word “Test” in Arial N8, a 2 cm high Maltese cross and a 2 cm high picture of a hot-air balloon.
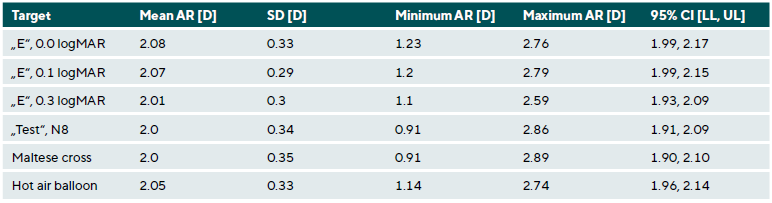
Results: The mean ± standard deviation values for AR were 2.08 ± 0.33 D for the letter “E” size 0.0 logMAR, 2.07 ± 0.29 D for the letter “E” size 0.1 logMAR, 2.01 ± 0.3 D for the letter “E” size 0.3 logMAR, 2.0 ± 0.34 D for “Test”, 2.0 ± 0.35 D for the Maltese cross and 2.05 ± 0.33 D for the hot air balloon. Statistically significant, but clinically not relevant differences were found between “E” size 0.0 logMAR and “E” size 0.3 logMAR (p = 0.02), “Test” (p = 0.02) and the Maltese cross (p = 0.01). Further, “E” size 0.1 logMAR showed significant differences to “Test” (p = 0.02), and the Maltese cross (p = 0.01). No other combinations were significantly different (p > 0.05). Refractive status (p > 0.05) and age did not significantly influence the AR (p > 0.05).
Conclusion: The size and shape of the targets have no effect on AR.
Introduction
Accommodative response (AR) measurements are frequently used in optometric practice to detect presbyopia or accommodation disorders.1 Accommodation is the alteration of the crystalline lens of the eye to obtain a sharp image in any target distance. AR describes the change of dioptric power when focusing on a close target.2 Various methods have been established to measure AR, such as the “Monocular Estimate Method” (MEM) or “Nott retinoscopy”.3,4 However, for research purposes, a valid and commonly used method is objective measurement using an openfield autorefractometer.5,6,7 A review of the literature showed that no standard target was consistently used for AR measurement, but various targets of different sizes and shapes. This raises the question of whether different targets yield different results or not. Several studies with different participant groups, such as children or children with attention deficit/hyperactivity disorder (ADHD), have been conducted to investigate the effects of form and size of the target on the AR. They provided conflicting results. Although, some argue that the shape of the target influences AR 8,10,11, others maintain the converse.9,12,13 It has been reported that targets, such as text, lead to higher AR compared to a single letter target. A correlation between AR and the complexity of a target has been discussed.8,14 Regarding target size, it has been reported that larger targets lead to lower AR.15 However, it has also been described that the dependence of font size is only examined for text targets and not individual letters.8 According to these contradictory results, the size and shape of the target could influence AR.
The aim of this study was to investigate the impact of size or shape of a target on AR to clarify the previously heterogeneous study results and to provide guidance for future research. To expand beyond studies limited to specific groups, the study was conducted with students.
Methods
This study was designed as a prospective, monocentric, univariate and transversal study. 51 students of the Ernst- Abbe-University Jena were included. The mean age was 25.8 ± 4.2 years. 73 % of the subjects were female and 27 % male.
This study was conducted in accordance with the International Conference on Harmonization E6 Good Clinical Practice (ICH-E6 GCP). To meet all ethical standards for research involving human subjects, the study followed the Declaration of Helsinki and was approved by the Ethics Committee of Friedrich-Schiller-University Jena, Germany.
The following hypotheses were examined: The shape of a target influences the AR. The size of a target influences the AR.
Participants
For inclusion, the participants had to be under 40 years of age. Participants with strabismus, no binocular single vision, accommodation amplitude less than 4 diopters (D), visual acuity higher than 0.1 logMAR, or taking medication that interfered with accommodation were excluded. The preceding sample size calculation showed that at least 49 participants had to be included in the study to test the hypothesis.
Measurements
One visit was conducted for each participant. The examinations were conducted at Ernst-Abbe-University Jena, Germany.
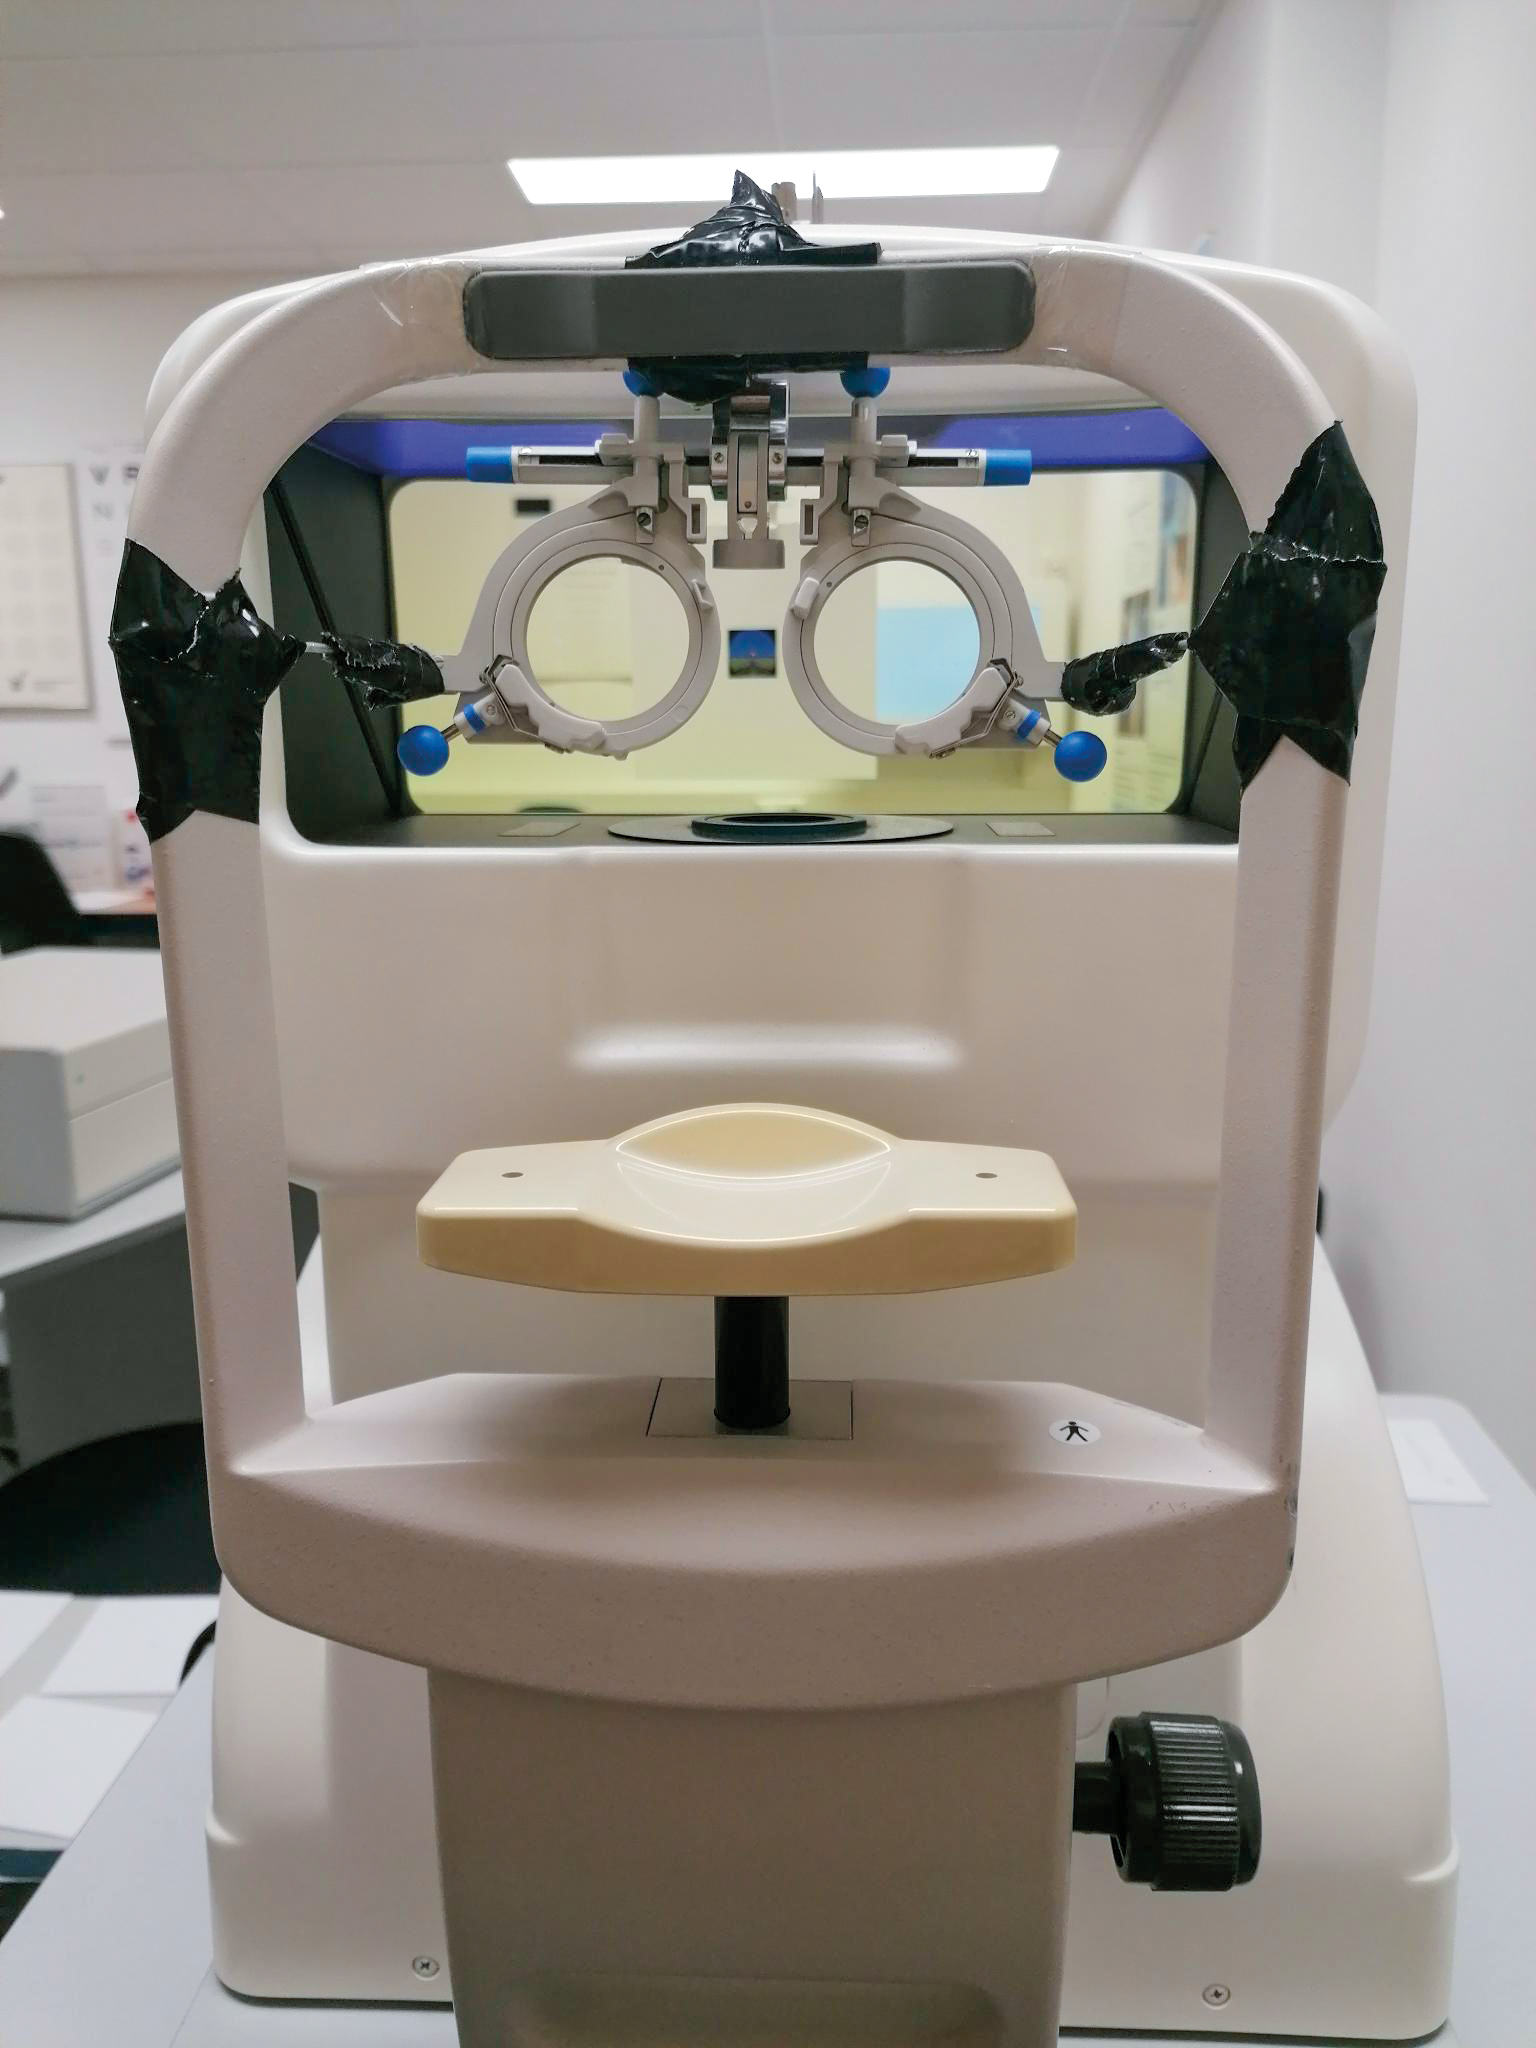
First, the participants were informed of the study objectives, measurements, and rights, and informed consent was obtained. The inclusion and exclusion criteria were reviewed, and participant information was collected. Visual acuity and amplitude of accommodation (AA) were measured. AR was measured on the sensory-dominant eye. Therefore, the plus 1 D test was performed, but with a −1.0 D lens for near distance.16 If the dominant eye varied for distance and near, the AR of the near-dominant eye was measured. The primary outcome measure was the objective AR for six different targets. The targets were the letter “E” in three sizes according to visual acuity 0, 0.1 and 0.3 logMAR, the word “Test” in Arial N8 font, a 2 cm high Maltese cross and a 2 cm high image of a hot air balloon. The targets were printed on 10 × 10 cm matt-white cards. Figure 1 shows the targets. AR was measured three times per target (18 measurements in total) in a random order. For AR measurements, a Grand Seiko WAM-5500 autorefractometer (Grand Seiko, Hiroshima, Japan) was used. This openfield autorefractometer allows the target to be changed and placed at different distances. In this case, the test cards were placed at a distance of 33 cm between the participant’s eyes. During the measurement, the participant focused on the target under binocular conditions for the purpose of habitual viewing conditions. This means that both eyes were involved in the fixation and accommodation process, and the convergence linked to the accommodation could contribute. However, only the dominant eye was measured. The monocular measurement under binocular conditions was chosen since most prior studies employed the same approach.8,9,10 To obtain AR using an autorefractometer, the refraction in both eyes had to be measured and corrected first. To implement the correction, the device was modified by adding lenses to a trial frame. Figure 2 shows the modified device. The participant was considered adequately corrected when the autorefractometer indicated a spherical equivalent (SE) of 0.0 ± 0.25 D.
Statistical Analysis
After AR was measured, the data were entered into an Excel spreadsheet and analyzed using SPSS 29.0 for Windows software (IBM Corp., Armonk, New York, USA).
To determine whether there were significant differences between the six different targets, a oneway repeated-measures analysis of variance (ANOVA) was performed on the means for each target. For the post-hoc test, Bonferroni correction was used, and statistical significance was set at an alpha level of 0.05. In addition, two repeated measures analysis of covariance (ANCOVA) were performed to examine whether refractive status or age had an influence on AR. The subjects were divided into three refractive groups: emmetropic (−0.5 D < SE < +1.0 D), myopic (SE ≤ −0.5 D), and hyperopic (SE ≥ +1.0 D). This classification was deliberately made asymmetrical to better reflect real-world refractive errors. It implies that myopic individuals typically require glasses or contact lenses at lower thresholds, whereas hyperopic individuals generally only seek correction at higher thresholds. In addition, the participants were divided into two groups according to age: age group 1 (< 30 years) and age group 2 (≥ 30 years).
Results
All 51 participants met the inclusion criteria and were included in the analysis.
The mean ± standard deviation of the AR values for all targets is listed in Table 1. The mean values were 2.08 ± 0.33 D for the letter “E” with a size of 0.0 logMAR, 2.07 ± 0.29 D for the letter “E” with a size of 0.1 logMAR, 2.01 ± 0.3 D for the letter “E” size 0.3 logMAR, 2.0 ± 0.34 D for “Test”, 2.0 ± 0.35 D for the Maltese cross and 2.05 ± 0.33 D for the hot air balloon. It can be observed that the values were within the same range. The letter “E” sized according to a visual acuity of 0.0 logMAR was the smallest target and resulted in the highest mean AR of 2.08 ± 0.33 D. The word “Test” and the Maltese cross both showed the lowest mean AR of 2.0 ± 0.34 D and 2.0 ± 0.35 D.
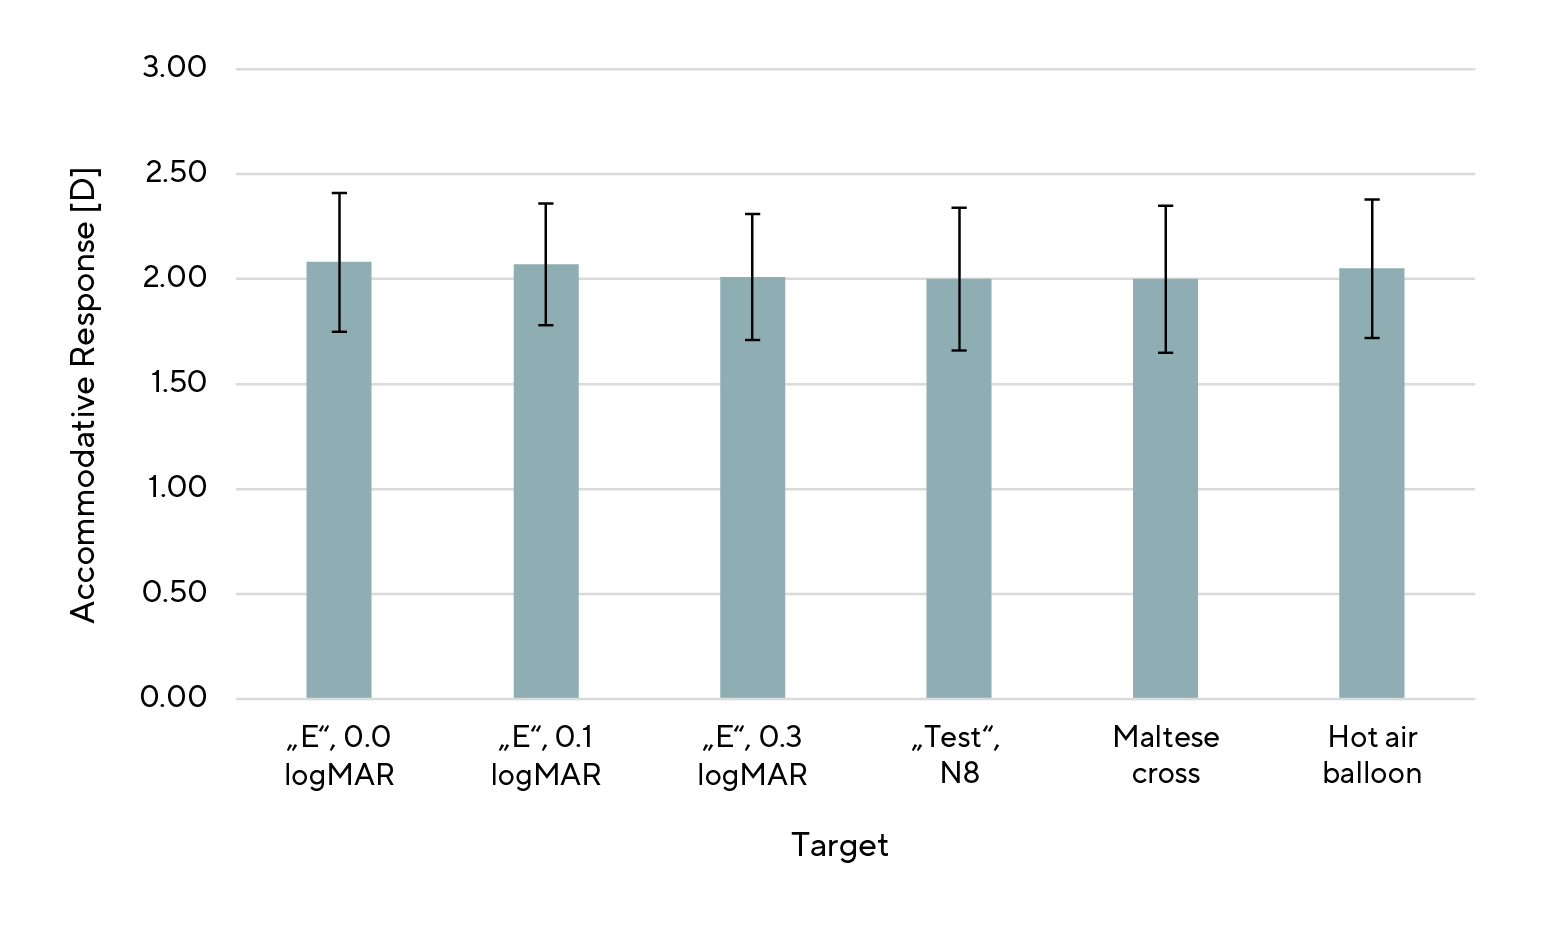
A one-way repeated-measures ANOVA was performed, and sphericity was confirmed using the Mauchly test (p = 0.18). Significant differences were found between letter “E” of size 0.0 logMAR and the letter “E” of size 0.3 logMAR (p = 0.02), “Test” (p = 0.02), and Maltese cross test (p = 0.01). The mean AR for the letter ”E” of size 0.0 logMAR was higher than the others. Likewise, the differences were significant between the letter “E” of size 0.1 logMAR and “Test” (p = 0.02), as well as the letter “E” of size 0.1 logMAR and the Maltese cross (p = 0.01). The mean AR for the letter ”E” with a size of 0.1 logMAR was higher than the others. No other combinations were significantly different (p > 0.05). Figure 3 shows the differences in AR caused by different targets.
For ANCOVA with repeated measures and refractive status as a between-subject factor, subjects were divided in three groups: n = 22 for emmetropes, n = 24 for myopes, and n = 5 for hyperopes. There was no significant impact of the refractive status on AR (p = 0.48). Furthermore, AR was not significantly associated with age (p = 0.77; n (< 30) = 43; n (≥ 30) = 8).
Discussion
This study analyzed the influence of target size and shape on AR in a group of students by using an open-field autorefractometer. We hypothesized that varying the sizes and shapes of the targets would lead to differences in AR. Our results showed statistically significant differences between some of the measurement results. However, these differences can be considered clinically insignificant , since the standard deviations of 0.29 - 0.35 D are within the device’s documented measurement uncertainty of approximately ±0.25 D.7
Regarding the size of the target, the literature reported that AR decreases with increasing target size.15 A possible explanation for this could be that a smaller target is more demanding than a larger one.8,14 In this study, the letter “E” targets can be used to examine the correlation between the size of the target and AR because all conditions except size are identical. The results show that there are significant but negligible differences between the smallest and largest letter “E” target, with the smaller target leading to higher AR. This could mean that small changes in size do not lead to significant differences in AR whereas larger changes do. A subsequent study could investigate the extent to which the size differences of the target must be to observe a relevant impact.
In addition, the difference in size variation between individual letters and text was investigated in previous studies, which concluded that only the font size of the text affected AR. The size of individual letters did not influence AR.8 As discussed above, the present study agrees with the findings concerning the individual letters. The present study could not provide any results regarding the influence of text font size because no text targets were used in these investigations. Hence, future studies could more precisely investigate the influence of text font size on AR.
Concerning the type or shape of a target, the literature states that AR depends on the shape of the target.8,10,11 This present study agrees with this statement within the limits of discussing statistical significance. Differences in AR derived from the shape of the target have been found between the letter “E” size 0.0 logMAR and the word “Test” as well as the Maltese cross. Also, the letter “E” size 0.1 logMAR showed differences to the word “Test” and the Maltese cross. In this case, it is difficult to suggest whether the differences must be attributed to the type of target or size because both characteristics may influence the result.
The image of the hot-air balloon was the only target that did not lead to any significant difference in AR compared with the other targets. This is unexpected, because the picture appears to be the most interesting because of its color and image composition, which can be described as demanding. According to the literature, this could have led to higher AR.8,14
Due to the narrow age range of the participants, no age-related effect on AR was expected. This was confirmed by the results. Moreover, no influence of the refractive status on AR could be detected, although myopes exhibited the lowest measured AR values. It should be noticed that, in both age- and refractive-status-based groupings, the groups were too small and the sample sizes too unequal to yield a valid result, thereby limiting the study’s interpretability. To enhance the statistical power in following studies, a new sample size calculation should be performed, as the underlying calculation for this study was based solely on the primary hypothesis and did not account for group division by age or refractive status. No literature could be found on either age or refractive status describing the influence of these factors on AR.
A reason why the differences in AR for the different targets are not significant or do not have any practical impact might be that the measurements were performed under binocular conditions. Mechanisms such as convergence-related accommodation, monocular cues to depth, and binocular visual summation are at play. These mechanisms could have operated correspondingly due to the constant test chart size and viewing distance, despite variations in targets. This might have the effect that not the target affects AR but the test card itself. Because of the small size of the test card, the participants could see the edges of the card. If the test cards had been larger, the influence of monocular cues of depth, such as relative size, perspective, and position in space, might have been less influential. To avoid the effects of binocular mechanisms, measurements would have needed to be conducted under monocular conditions. This would have led to the problem of loss of convergence, which is part of the habitual accommodative process and therefore should not be neglected. A control group under monocular conditions, or an additional monocular measurement, would have provided insight into these relationships and should be considered in a follow-up study.
Strengths and Weaknesses
This study had a strong design that led to reliable and valid results. The procedure was almost free of the influence of the investigator because an objective measurement method was chosen. Regardless, the investigator verbally instructed the participants and may have used different wording for the explanation. This may have led to different behaviors of the participants and, accordingly, to varying results.
Although the study varied both the size and the shape of the target, lager variations would be beneficial to obtain more meaningful results. The contrast, coloring, time of presentation, and dimension of the target may also be interesting characteristics to investigate.
In addition, the correction of refraction before the actual AR measurement had a degree of freedom of ± 0.25 D which could have led to small deviations.
Note also that the participants came from an academic environment, representing a limited age and population structure, which may limit the generalizability of the results.
Conclusion
This study provides further insights into the dependency of AR on the size and shape of a target. The targets used in this study did not have an impact on AR under the given conditions. Therefore, there may be no need for a standardized target for AR measurements. Nevertheless, a follow-up study with a larger, more representative sample and extended methodology could be interesting to obtain even more reliable results or to broaden the variables explored.
Conflict of interest:
The authors have no conflict of interest with respect to the methods and devices mentioned in the article.
COE Multiple Choice Questionnaire
The publication "Target-specific Differences in the Measurement of Accommodative Response" has been approved as a COE continuing education article by the German Quality Association for Optometric Services (GOL). The deadline to answer the questions is 01st November 2026. Only one answer per question is correct. Successful completion requires answering four of the six questions.
You can take the continuing education exam while logged in.
Users who are not yet logged in can register for ocl-online free of charge here.