Visual acuity and contrast sensitivity during defocusing in relation to luminance
Purpose: The change in refraction with decreasing luminance towards myopia is described as a cause of visual problems at twilight and night. The aim of the study was to investigate the influence of defocus measurements on visual acuity and contrast sensitivity under mesopic conditions.
Material and Methods: This prospective cross-sectional study was conducted in right eyes of 31 subjects (age 26 ± 3 years) under luminance levels of 0.05, 0.1, 1 and 10 cd/m². Baseline subjective refraction was determined under photopic conditions (100 cd/m²). Landolt C were used for visual acuity. Contrast sensitivity was tested with gratings at spatial frequencies of 3, 6, 12 and 18 cpd. Defocus curves were obtained using FrACT and trial lenses ranging from −1.00 to +0.50 dpt.
Results: Visual acuity decreased by approximately 0.2 logMAR per decreasing luminance level. The maximum increase in visual acuity was less than 0.1 logMAR with minus lens correction. The highest improvement was quantified at 0.03 logMAR (p = 0.04). Maximum increase in contrast sensitivity was 0.17 logKE (p = 0.002). These changes were not clinically relevant. Clinically relevant increases in visual acuity and contrast due to correction of twilight myopia were demonstrated in four subjects.
Conclusion: A decrease in vision quality at twilight and night appears to be more due to the physiological reduction in visual acuity with decreasing luminance than to a change in refractive status. The phenomenon of twilight or night myopia could not be demonstrated using defocus curves. In individual cases, testing for twilight myopia may be useful in order to improve the quality of vision.
Introduction
Patients frequently complain about vision problems at twilight and at night in optometry or ophthalmology practices. One possible cause could be changes in refraction as luminance decreases. Twilight myopia can occur in mesopic light conditions, whereas in scotopic luminance this change in refraction towards myopia is referred to as night myopia. In a publication by Aulhorn and Harms, approximately 25 % of participants exhibited relevant night myopia, with severe forms (< −0.75 D) occurring in less than 5 % of the cases.1 Epstein et al. published that 9 % of their 163 test subjects experienced myopisation of at least 1 D. However, only two of these subjects benefited from a correction of night myopia.2 Some authors reported values of up to −5 D for night myopia.2,3 More recent studies have shown values between −0.25 and −1 D with high individual variance.4,5 Chirre et al. were also able to show that night myopia is higher under monocular conditions than under binocular conditions.5
One possible cause of this refractive change is the Purkinje shift related to chromatic aberration.6 Here, shortwave light is refracted more strongly than longwave light, which can lead to a myopic shift under scotopic conditions. Namely, the Purkinje shift increases sensitivity to shorter wavelengths in darkness. The refractive error induced by this does not surpass, theoretically, a maximum of −0.4 D and cannot fully ex-plain night myopia.4 The most significant cause is considered to be the resting position of accommodation.4 In complete darkness or with greatly reduced fixation stimuli, the eye adjusts to a resting position, which can lead to a myopic shift. Chirre et al. were able to determine an average myopisation of approximately −0.5 D using an openview aberrometer.5 Whether being able to focus in the dark is relevant for prac-tical conditions such as nighttime driving should be critically examined, as a fixation stimulus is usually present. Another cause is spherical aberration. In twilight and darkness, this can lead to additional refractive errors in the range of 0.1 to 0.5 D.7,8 However, Chirre et al. and Artal et al. were able to show that taking spherical aberration into account hardly changes the refraction measurement results, so its influence can be considered rather low.4,5
Twilight myopia is clinically relevant in everyday situations such as nighttime driving. The constant accommodation and fixation stimuli when driving suggest that it may be necessary to differentiate between twilight and night myopia. Studies have shown that some of the subjects affected can improve their visual acuity and comfort through targeted correction of night myopia.9 Furthermore, Cohen et al. demonstrated a link between night myopia and traffic accidents showing that test subjects with refractive changes above −0.75 D were comparatively involved in more accidents.10
Many studies in the field of twilight and night myopia date from the period between 1945 and 1980. The research conditions of these studies are sometimes difficult to verify. On the one hand, the measuring systems used are no longer available today and, on the other, the methodology was often described imprecisely in the respective publications. When it comes to twilight and night vision, the subjective perception of improvement and deterioration in vision plays a particularly important role. In this context, subjective measurement methods should be made as objective as possible to examine changes in refraction with decreasing luminance and investigate the following questions:
- How do visual acuity and contrast sensitivity change with decreasing luminance?
- How does the refractive status change with decreasing luminance?
- At what luminance does a shift in refractive status occur?
- Can correction for mesopic lighting conditions improve visual acuity and contrast sensitivity?
Materials and methods
This prospective cross-sectional study was conducted in the right eye of 31 test subjects aged 26 ± 3 years. The mean refractive error was −1.23 ± 3.24 D. Only test subjects aged between 18 and 40 were included (to exclude presbyopia and media opacity) and with visual acuity of at least 0.8 with or without correction and binocular single vision. Test subjects with ocular or systemic diseases affecting the visual system (e.g. diabetes), alcohol or drug use, hormonal fluctuations (e.g. due to pregnancy, breastfeeding, medication) or concentration disorders (e.g. due to fatigue or drug use) were excluded. The study was conducted in accordance with Good Clinical Practice guidelines and complies with the ethical principles of the Declaration of Helsinki. All subjects were informed in writing and verbally and were included in the study after signing a consent form. The study was approved by the Ethics Committee of the Friedrich Schiller University Hospital in Jena.
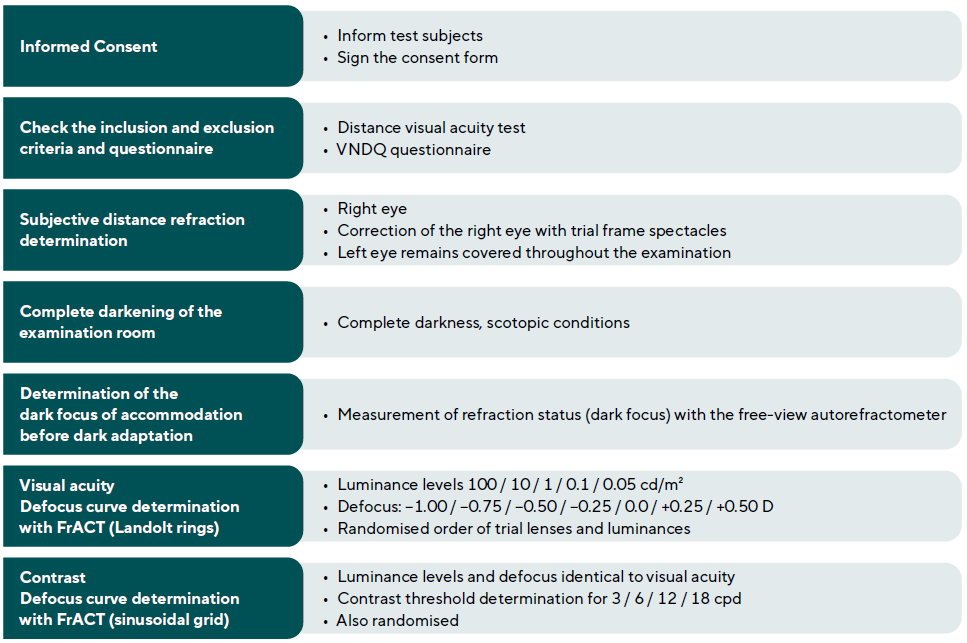
The tests were conducted in a room that could be completely darkened to adjust the luminance between photopic and scotopic lighting conditions at a test distance of 6 m. A Polatest E (Carl Zeiss Vision GmbH) was used for subjective refraction determination in photopic light conditions (baseline). The defocus curves for visual acuity and contrast sensitivity were determined using FrACT 11 (Freiburg Acuity, Contrast, Vernier and Grid Test) on a Color Edge CG246 display (Eizo). To darken the display's intrinsic luminance, a grey filter No. 211 with a 0.9 neutral density (LEE Filters) was attached in front of the display at low luminance levels. The dark focus of accommodation was measured using the WAM 5500 open-field autorefractometer (Grand Seiko). The LMK 5 luminance measurement camera (Technoteam Bildverarbeitung GmbH) was used to measure and calibrate the test setup. Subjective visual quality was determined using the Vision and Night Driving Questionnaire (VNDQ) according to Kimlin et al.12
A threshold test (in this case visual acuity or contrast) was determined as a function of optical defocus to be able to plot the defocus curve. The test was performed monocularly, with the subject's eye subjectively fully corrected for a specific condition (in this case, photopic lighting conditions at a 6 m distance). Defocusing was achieved by placing spherical dioptric effects in front of the eye, as well as a control lens in the form of a 0 D lens. In this case, seven trial lenses were placed in front of the eye in a trial frame spectacle in a randomised order (−1.00 / −0.75 / −0.50 / −0.25 / 0 / +0.25 / +0.50 D).
To obtain the visual acuity defocus curves the visual acuity for each trial lens was determined using Landolt rings on the FrACT. In order to do so, the test subject held a keyboard in their hand, with which they could enter the corresponding direction of the ring opening. 24 Landolt rings were presented in 8 different directions for each run. After each run, the visual acuity was given in logMAR. The visual acuity data was plotted as a function of the corresponding defocus. This process was repeated for five luminance levels (100 cd/m², 10 cd/m², 1 cd/m², 0.1 cd/m² and 0.05 cd/m²). When changing the luminance levels, the neutral density filter had to be changed accordingly so that the desired test field luminance could be achieved. The test was not performed for −0.75 D and −1.00 D in the case of photopic luminance. The aim of the test for photopic conditions was merely to establish a reference for full correction. This would not be achieved if the visual acuity increased at −0.25 D or did not decrease at +0.25 D or, if applicable, at +0.50 D. The test under photopic luminance conditions was therefore always performed at the beginning of the measurement series.
The defocus curves for the contrast threshold were determined using the same trial lenses for the specified luminance levels at four spatial frequencies in each case. The spatial frequencies were adapted to the established CSV-1000 (Vectorvision) test procedures and the Vistech charts. Tests were carried out at 3 cycles per degree (cpd), 6 cpd, 12 cpd and 18 cpd. The sinusoidal grid used can assume four different directions and was displayed in a circular shape (diameter 15 cm). It was presented 24 times per run. The contrast sensitivity (reciprocal of the determined contrast threshold) was then plotted as a function of the defocus value.
The different luminance levels were achieved by dimming the room lighting using fixed settings. The windows of the examination room were completely darkened. Additionally, the visual display with the optotypes was darkened using a neutral density filter (LEE Filters No. 211, 0.9 neutral density). The luminance was reduced in such a way that the corre-sponding test luminances could be achieved. After darkening the display with the filter, the contrast of the optotypes was checked using the LMK 5 luminance measurement camera (Technoteam Bildverarbeitung GmbH). The test procedure is shown in Figure 1.
The data was analysed statistically using IBM SPSS Version 25 and Microsoft Excel. The inductive statistics used exclusively comprise common methods for normally distributed variables. The significance level was set at α = 0.05. In the case of multiple tests, the significance level was corrected according to Bonferroni-Holm. The Shapiro-Wilk test was performed to check for normal distribution, resulting in all variables being normally distributed (p > 0.05).
Results
Visual acuity
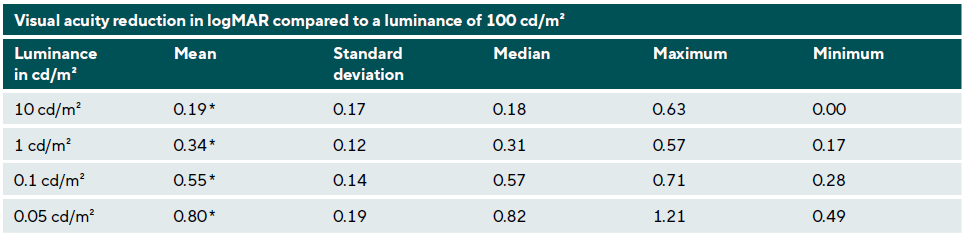
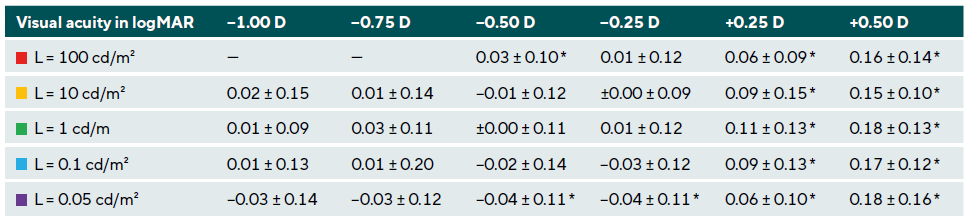
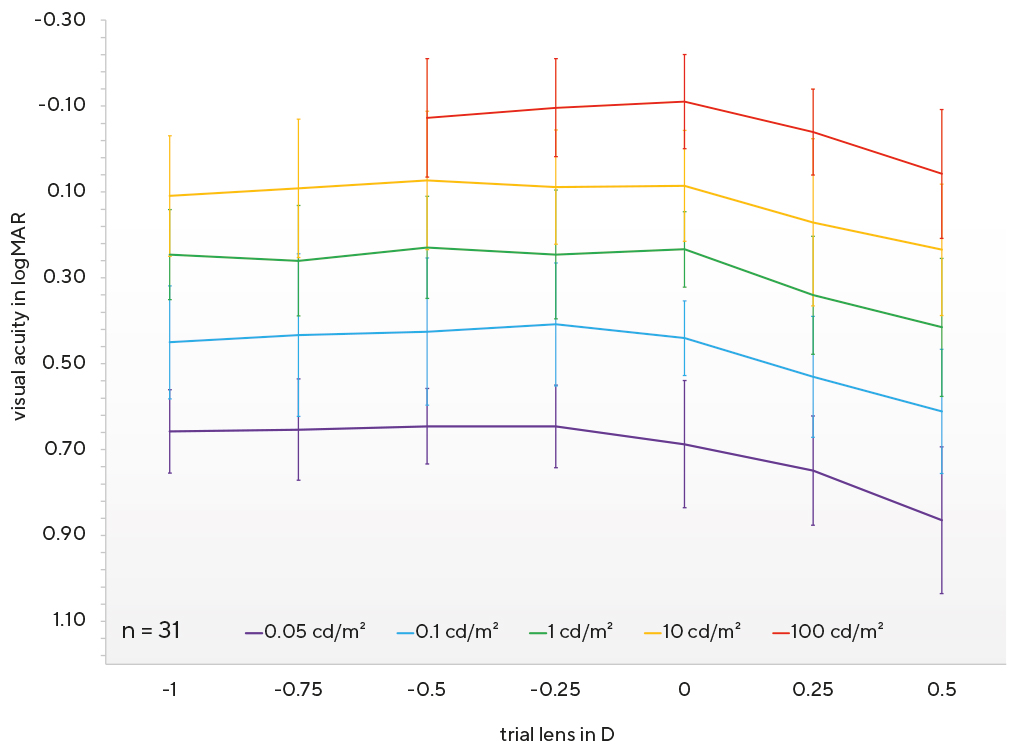
This section contains the results of the visual acuity test. For clarity, we have chosen not to show the descriptive results of the individual visual acuity measurements during defocusing. The graph in Figure 2 shows visual acuity in logMAR at five different luminances during defocusing. It is immediately apparent that visual acuity declines as luminance decreases. Table 1 shows that the reduction in visual acuity per tenfold decrease in luminance is approximately 2 visual acuity levels (0.2 logMAR). The difference between the visual acuity for the corresponding luminance level and the visual acuity at photopic luminance (100 cd/m²) was calculated. In each case the visual acuity values in logMAR with the 0 D lens were used. The large variations in the minimum and maximum values are also striking. Looking at the lines representing the individual luminance levels in Figure 2, it can be seen that visual acuity decreases when plus lenses are used, while it remains at a relatively constant level when minus lenses are used. Taking into account the quite high dispersion, it can be observed that a change in the correction status does not lead to a clinically relevant improvement in visual acuity at any of the luminance levels tested. These differences in visual acuity are shown in Table 2 as a function of luminance. Here, the corresponding trial lens is compared with the 0 D lens in terms of visual acuity. Negative values indicate an improvement in visual acuity, while positive values indicate a deterioration. It is noticeable that all values in the positive range indicate a statistically significant reduction in visual acuity. When minus lenses were used, statistically significant improvements in visual acuity were only observed at L = 0.05 cd/m². However, this cannot be assumed to be clinically relevant, as the improvement is less than half a visual acuity level on average. Thus, a change in the correction values for mesopic lighting conditions at the luminance levels tested does not lead to an increase in visual acuity. No myopisation was observed with decreasing luminance.
Contrast sensitivity
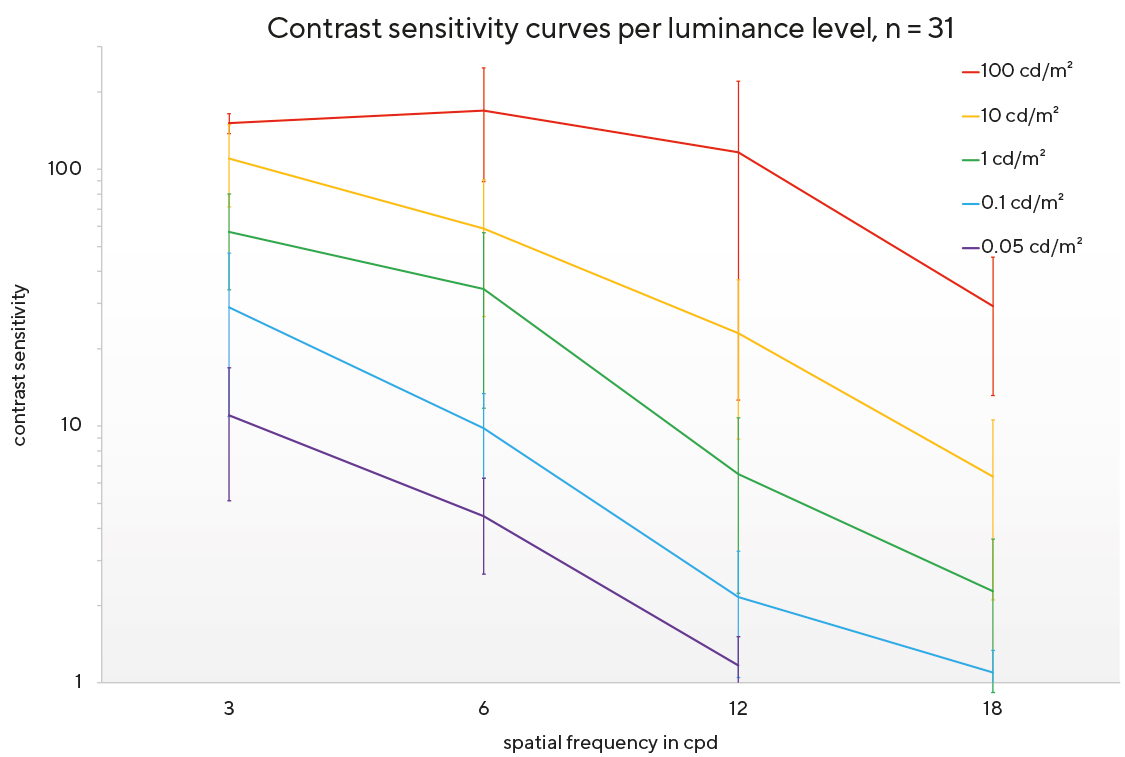
After examining visual acuity, we analysed contrast sensitivity. The aim here was to test whether a correction adjustment leads to an increase in contrast sensitivity in mesopic lighting conditions. For clarity, we have chosen not to show the descriptive results of the individual contrast sensitivity measurements. Figure 3 illustrates the contrast sensitivity curves at five different luminance levels without defocus (0 D lens). As expected, contrast sensitivity decreases in mesopic lighting conditions as the spatial frequency increases.
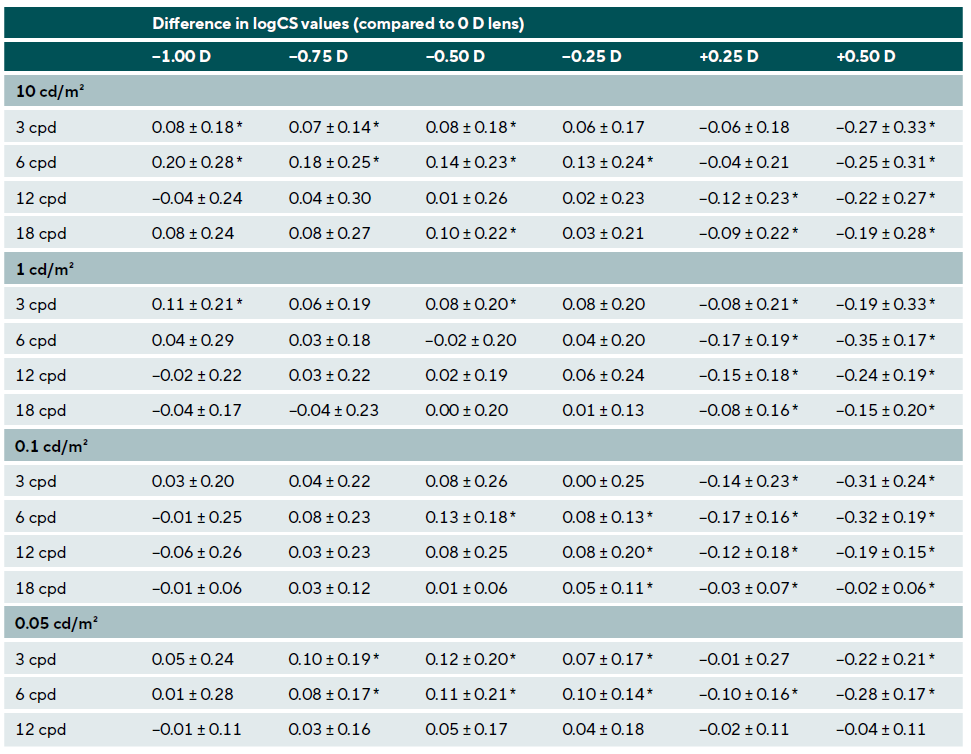
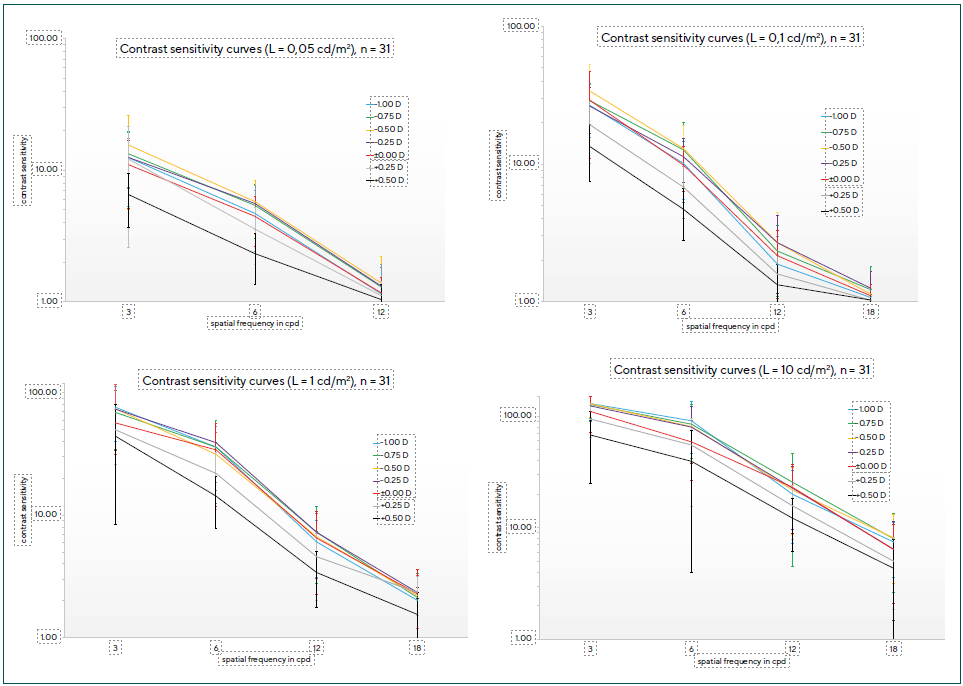
Table 3 shows the differences in contrast values per luminance level at different spatial frequencies under defocusing conditions. As with visual acuity, a reduction in contrast sensitivity can also be seen here after adding plus lenses. This is illustrated in Figure 4, as the contrast sensitivity curves for plus lenses show lower sensitivities. Contrast sensitivity increases slightly in some cases when using minus lenses between −0.25 and −0.75 D. The relatively large dispersion, reflected by the standard deviations, is striking. Even though some differences are statistically significant when minus lenses are used, this cannot be assumed to be clinically relevant for the population as a whole. However, both the high dispersion and the significance found emphasise the importance of an individual analysis of each case. This applies to all luminance levels tested. Within the cohort of this study, clinically relevant improvements in contrast vision were found in four subjects. It can therefore be concluded that improving contrast sensitivity by adjusting the correction for mesopic lighting conditions is only possible in individual cases.
Subjective visual quality
A variance analysis (ANOVA and ANCOVA) was used to test whether the presence of vision problems at twilight or at night and the VNDQ score were related to the results of the defocus measurements and the physiological loss of visual acuity and contrast with decreasing luminance. No significant influence could be detected. Visual acuity and contrast sensitivity do not change differently in subjects with and without vision problems at twilight or at night. In addition, it was found that the level of dark focus of accommodation has no influence on improving visual acuity at twilight and at night when minus lenses are used. Test subjects with a higher dark focus value therefore do not benefit more from a minus correction than test subjects without a shift in accommodation status. The level of dark focus in this study was −0.03 ± 0.33 D.
Individual case study
Due to the high degree of variation and the significance that could be proven for some cases, two individual cases will be presented in this section to underline the importance of considering the topic of this study on an individual basis.
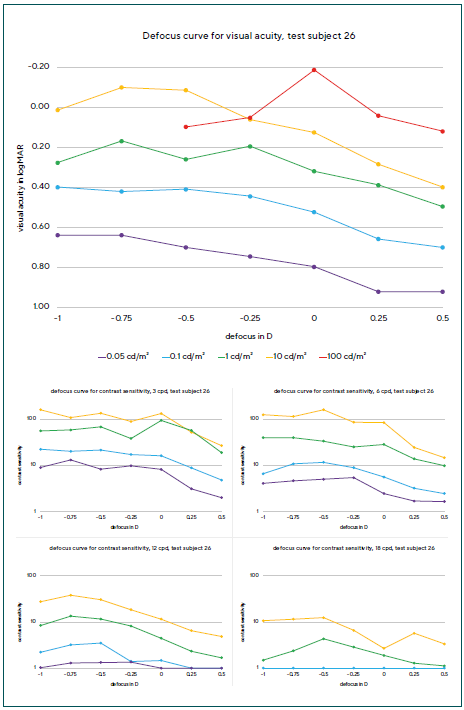
Test subject 26 (Figure 5) was a male individual. He had no vision problems at twilight or at night, although measurable refractive changes were observed. Thus, visual acuity in mesopic lighting conditions could be increased by up to 2 visual acuity levels (0.2 logMAR) by prescribing spectacles with −0.50 and −0.75 D respectively. The defocus curve for photopic light conditions shows that the test subject was fully corrected for photopic light conditions at the beginning of the measurements, as visual acuity decreased at +0.25 D. Clinically relevant improvements were also observed in contrast vision. The contrast threshold increased by up to 30 % in some cases through an adjusted minus correction, with the strongest changes observed at a spatial frequency of 12 cpd in the upper mesopic range. This corresponds exactly to the luminance levels that are relevant for vision at twilight and at night.
Test subject 26 is therefore a case of twilight myopia. Both visual acuity and contrast sensitivity could be optimised by adjusting the correction with more minus diopters at twilight and at night. It is also clear that contrast sensitivity deteriorated rapidly in the absence of full correction, especially in cases of undercorrected myopia or overcorrected hyperopia. This is particularly evident in the contrast sensitivity curves at a defocus of +0.25 D.
Test subject 13 (Figure 6) was a female individual who reported problems with twilight and night vision. It can be seen that visual acuity increased by about one level, especially at the lower two luminance levels tested, when wearing minus lenses. Contrast vision also improved at luminances between 10 cd/m² and 0.1 cd/m², i. e. precisely the brightness levels that are crucial for vision at twilight and at night. Here, too, an adjusted correction with an effect between −0.25 and 0.5 D would probably have a positive effect on the visual perception of the patient. As already mentioned, these two different cases show that, despite the lack of statistical significance, there are individual cases of twilight myopia where correction brings about a considerable improvement in visual quality. In both cases, the dark focus of accommodation could not explain the change in refraction.

Discussion
In this study we used a novel approach and evaluated changes in visual acuity and contrast sensitivity as a function of luminance and plotted them as defocus curves. The advantage of the defocusing method in combination with the FrACT used is that visual impression and results are less dependent on subjective perception. This could be the reason why only four of the 31 test subjects showed an increase in visual acuity of at least one level thanks to the correction of twilight myopia. At this point, it should be noted that the age of the subjects does not allow for a generalisation of the results to all age groups. As in other studies addressing this topic, the measured results show interindividual differences.5,4,13 These differences can be observed in all variables, so the significance of a subject-specific assessment should be emphasised. In practice, it is therefore recommended that, in the case of vision problems at twilight or at night, a subjective refraction test be carried out in a dark room using optotypes. If visual acuity improves as a result of a change in refraction, an adjusted correction for twilight and nighttime conditions could lead to an improvement in visual quality. The importance of considering the need for correction of night myopia on an individual basis has already been underlined by Owens and Leibowitz.14 Furthermore, Charman claims that accurate correction of refractive error is more important at night than during the day.15 When driving at night, luminance levels of around 1 cd/m² prevail, meaning that no significant refractive changes occur.15 The high levels of night myopia in the study by Epstein et al. are therefore not transferable to road traffic (twilight).2
Another reason for the high variation besides interindividuality could be found in the guessing probability of the test procedure. This is 12.5 % for the visual acuity test and 25 % for the contrast threshold test. The reproducibility of the FrACT has already been confirmed by Wesemann.16 Moreover, it can be assumed that the long examination time of approximately two hours, despite several breaks, had an influence on the concentration of the test subjects and thus also on the results. A decision was made not to split up the examination procedure, as fluctuations in refraction, contrast vision, tear film, accommodation status, etc. throughout the day could also influence the measured results. In addition, input errors in the assessment of ring and grid directions must be taken into account.
Regarding the results of the visual acuity test, it is virtually impossible to compare them with other studies, as the methodology and test conditions vary greatly. For example, some publications did not work with specific luminance levels, but rather only an adaptation state. However, in the present study, visual acuity also differed within the individual adaptation states, for example between luminance levels of 1 cd/m² and 0.1 cd/m², both of which belong to the mesopic range. The effect of decreasing visual acuity as a function of luminance can be described as a physiological reduction in visual acuity with decreasing luminance. Perez Carasco et al. found a visual acuity of 0.28 ± 0.1 logMAR at a luminance between 0.1 and 0.2 cd/m².17 In the present study, visual acuity at this luminance level was about 2 steps lower. However, Carasco et al. did not use a display-based system for presenting optotypes, but rather Bailey-Lovie charts. These visual acuity charts use letters rather than Landolt rings, some of which are much easier to recognise than the latter, thus favouring higher visual acuity.8 The data from Tyrrell et al. show better agreement with the present study results. Their study group found that visual performance in civil twilight, i.e. in the lower mesopic luminance range, falls to 20 % of the photopic value.19 The data from the study presented in this paper show a difference of 0.8 logMAR between the average visual acuity at 0.05 cd/m² (0.69 ± 0.15 logMAR) and the photopic value (−0.11 ± 0.11 logMAR). This corresponds to less than 20 % of the photopic value. At 0.1 cd/m², the visual acuity was 0.44 ± 0.09 logMAR, i. e. slightly more than 20 % of the photopic value. The data collected corresponds with the visual acuity values published by Hartmann, who reported that visual acuity also decreases by approximately 2 visual acuity levels per tenfold decrease in luminance between 100 and 0.01 cd/m².20
It should also be noted that Annex 6 of the German Driving Licence Regulation, which defines the requirements for vision in road traffic, does not take into account visual acuity at twilight or at night.21 Only a contrast and glare test is required to test twilight vision. However, the daytime visual acuity of 0.7 required for driving is not achieved in mesopic luminances. Figure 2 clearly shows that at luminances below 10 cd/m², visual acuity generally falls below the minimum visual acuity requirement of 0.7. There is no guideline or legal requirement in Germany for reduced twilight visual acuity.
The results for contrast sensitivity also showed considerable variation. These have already been published by other authors for different lighting conditions.22,23 Just like in the case of visual acuity, contrast sensitivity decreases with decreasing luminance. This confirms the findings of Valois et al., who also observed a reduction in contrast across all spatial frequencies with decreasing luminance.24 Furthermore, the results of this study correspond with the values reported by Bühren et al.22 Their research group found a contrast reduction in young subjects at 1.5 cpd from 2.23 to 1.23 logCS. There are no known groundbreaking studies that address the clinical relevance of changes in contrast sensitivity under mesopic lighting conditions. An improvement in contrast sensitivity is mainly found in the upper mesopic luminance range and at medium spatial frequencies around 6 cpd. Under certain conditions, the average sensitivity improves by up to 0.20 logCS. In terms of clinical relevance, it can be assumed that a contrast improvement of less than 0.15 logCS is not subjectively no-ticeable. In terms of Weber contrast, this value corresponds to one line when tested with the Pelly-Robson chart. Thus, in individual cases, an adjusted minus correction can lead to an improvement in contrast sensitivity under mesopic conditions. However, no correlations with other parameters, such as the dark focus of accommodation, are apparent. This contradicts the publication by Chirre et al., which associates night myopia with a myopic dark focus value.5 However, that research group did not work with defocus methods, but rather with a freeview aberrometer.
The question arises as to whether measuring contrast sensitivity in optometric practice is crucial for twilight and night vision. After testing refraction in the dark, it is advisable to demonstrate to the test subjects the advantages of an adjusted correction for mesopic conditions. Reality vision tests or low-contrast optotypes could be helpful for this purpose. Routine testing of contrast sensitivity in the form of threshold determination does not offer any significant advantages over subjective refraction determination for vision in twilight and night-time traffic conditions.
Conclusion
In this study we could not observe a change in refraction with decreasing luminance. Thus, no twilight or night myopia was detectable overall. However, individual cases showed a possibility of optimising visual acuity and contrast sensitivity by prescribing minus lenses for such lighting conditions. Individual testing for refractive changes in mesopic lighting conditions is recommended in practice. If visual acuity and contrast improve, an appropriate correction for twilight and night-time should be prescribed.
Conflict of interest
The authors have no conflict of interest regarding the meth-ods and devices mentioned in this article.