Pros and Cons of soft contact lens power mapping
Purpose: To provide an overview of currently available methods and instruments for the measurement of soft contact lens power maps, together with their advantages and potential shortcomings.
Material and Methods: The three leading measurement principles of Moiré Fringe, Shack-Hartmann and Phase Shifting Schlieren were identified, and the relevant literature reviewed and technical specifications summarised. To demonstrate some of the potential deficiencies associated with optical power mapping, a series of measurements were conducted on toric, multifocal and extended depth of focus lenses, using one representative instrument. Raw measured data were analysed using various analysis tools and parameters.
Results: Power maps and power profiles are presented for the various lens types. Different smoothing filter settings resulted in significantly different power profiles near the optical centre. The ‘Power versus Azimuth’ profiles showed unexpected results.
Conclusion: While all three methods are generally reliable and easy to use, there are still some limitations which need to be considered when interpreting the results. In particular, the profile filter settings need to be chosen carefully for multifocal and extended depth of focus lenses. The need for accurate refractive index data for lens material and solution was demonstrated.
Introduction
The optical quality of a contact lens is one of the most critical factors that contributes to successful lens wear. Without predictable and consistent optimal vision correction, practitioners and patients may fail to perceive contact lenses as a viable option and revert to spectacles or consider surgical treatments. This has been recognised by the profession and industry since the early days of rigid and soft lens commercialisation. All major markets have developed regulations and standards that specify quality and labelling standards for contact lenses. The specifications within ISO 18369 Parts 1 – 4 are recognised worldwide and all the leading manufacturers adhere to its specifications and tolerances. In relation to optical power measurements, this standard only applies to spherical and toric contact lenses. Bifocal, multifocal, and the recently introduced extended depth of focus and myopia treatment lenses are not captured under this standard; neither are aspects of spherical or higher order aberrations, nor general optical quality. This may be partly due to limitations of the traditionally available instrumentation to measure these optical properties. The focimeter is still widely used by practitioners to measure sphere and cylinder power as well as cylinder axis of contact lenses in air. No further parameter can be obtained with this equipment. This instrument requires considerable skill to operate, in particular with respect to proper centration and avoiding lens dehydration.
Over the last 30 years, several new methods and instrument had been developed that can measure a complete power map of soft contact lenses while immersed in solution. Two of these techniques are now accepted and listed in ISO 18369-3,1 with the third Schlieren method currently under consideration. While these instruments have significant advantages over prior methods, which contributed to their widespread use in contact lens manufacturing and research,2–4 they are not without shortcomings, which should be kept in mind when using them and relying on their results.
Methods and Instrumentations
There are currently three main technologies utilised to measure power maps of contact lenses. With all of them, the soft contact lens is placed inside a solution filled, parallel sided wet cell. The collimated measurement light beam passes through the lens and the emerging distorted wavefront is captured on the opposite side to be analysed and converted into numerical power parameters. All instruments also have integrated capabilities to capture and display real time images of the complete lens. Using image analysis tools, the outside diameter of lens is determined. By default, the centre of this diameter is assumed to be the optical axis of the lens, although, some instruments allow user intervention to define the optical centre. With the optic centre being defined, the user then needs to specify the optic zone diameter. Only data points within this diameter will be used to analyse the wavefront and extract numerical parameters for sphere and cylinder power or any other optical characteristics.
The first method implemented in a commercial instrument and recognised in the ISO standard is based on the Moiré Fringe principle.5 The wet cell with contact lens is placed in between two parallel line patterns. The slope distortions of the line patterns are captured with a camera. They represent the power map of the contact lens from which power values and power profiles can be extracted.
The most commonly used method to measure wavefront distortions in general optics and ophthalmic applications is based on the Shack-Hartmann sensor. As with the Moiré method, collimated light passes through the contact lens before the light beam is split up into many sub-beams by an array of tiny lenslets.6 Each of the sub-beams is focused on a CCD or CMOS camera chip where the location of each spot is registered to reconstruct the wavefront. The number of lenslets determines the lateral resolution of this measurement method, while the lenslet power affects the measurement sensitivity and range.
The third method is based on the Phase Shifting Schlieren technique. Hereby, the wavefront passes through an LCD light modulator that generates the Schlieren fringes in combination with the contact lens power.7 The modulated light intensity is captured by a camera and the Schlieren image analysed to extract the power map. The lateral resolution is determined by the pixel resolution of the camera and can be as high as 36 µm.
A summary of the instruments available based on these three methods is listed in Table 1.
Although the measurement principles of these three instruments are distinctly different, they all share similar features and limitations, which shall be discussed below.
Features and Limitations
All three methods capture the wavefront in single path as collimated light passes through the lens and wet cell. This implies that the any distortions within the captured wavefront can be due to the contact lens, the solution or the wet cell itself. Solutions are to be kept clean and homogenous to minimise their influence. ISO 18369-3 also recommends equilibrating soft lenses in the same solution which is used in the wet cell for sufficient time prior to taking any measurements. This should prevent any residual inhomogeneity within the lens material. Two hours is generally considered to be sufficient. The optical quality of the wet cell should be better than λ/4 to avoid misleading results. Alternatively, the wavefront distortion through the solution filled wet cell can be captured and subsequently subtracted from the wavefront measurement with the contact lens in the wet cell.
Although the wavefront measurement itself is to a large extent automated, fast and objective, there are still a few factors where operator skill and diligence can influence the result. When placing the contact lens in the wet cell, it is important to let it settle gently into the V-groove to avoid any distortions. The operator also needs to ensure that the lens rests with the edge down and is not turned inside out, which would slightly change the sag and diameter of the lens. A brief settling time is recommended before taking the measurement, small lens or solution movements can lead to minor wavefront distortions. This latter point, together with the still largely manual lens handling limit the overall measurement time to approximately 1 – 2 minutes per lens. While this is not of concern for practitioners or research investigations, in mass production, where statistical sampling is required for each lot, this is a significant cost factor. This is partly offset by the simultaneous diameter measurement, which is a feature of all the commercial power mapping instruments.
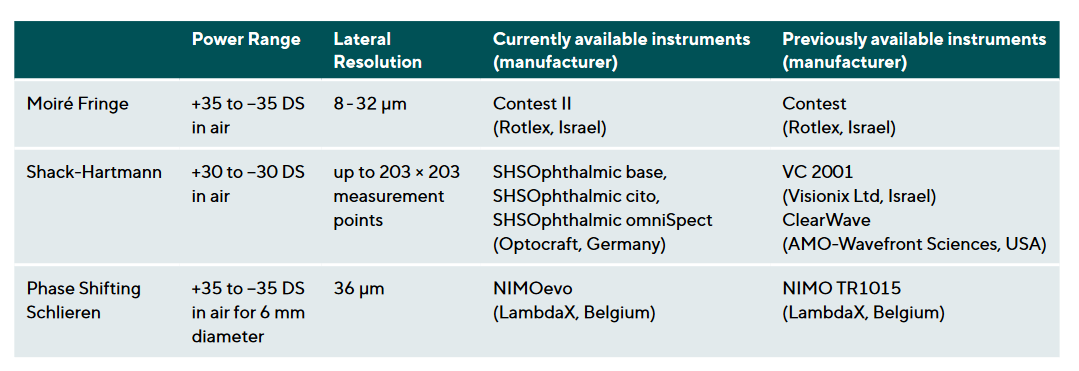
The automated diameter determination, based on image analysis of integrated video capture, can also be used to determine the geometrical centre of the lens, which is assumed to be identical with the optical centre which is needed for analysing the captured wavefront. Additional image analysis tools are applied for toric lenses to detect the orientation of the lens based on commonly used line markings in the lens periphery. This further enhances the objectivity of the measurement results. Knowing the optical centre of a contact lens is particularly important for lenses with steep changes along the power profile, such as the ring designs of presbyopic or myopia treatment lenses and extended depth of focus lenses. Even minor decentration errors can lead to loss of fidelity of the measured power profiles.8 With the automated optical centre determination being based on the outside edge of the contact lens, two factors can contribute to inaccuracies. The optic zone of a lens may not be concentric to the outside diameter of the lens due to manufacturing tolerances, or an excessive lens prism may generate uneven shadows around the edge which impedes the image analysis in determining the lens diameter and centre. This latter effect can be particularly pronounced in prism ballasted soft contact lenses. Figure 1 illustrates the sensitivity to minor variations in determining the optical centre for a lens with concentric ring zones of different power. The same lens (MiSight, CooperVision, USA) was measured independently ten times using the NIMOevo (LambdaX, Belgium) power mapping instrument. The standard deviation of the radial power profiles for each datapoint along the optic zone diameter is plotted and shows distinct spikes at each point where the power profiles switch between high and low powers.
The traditional focimeter is still widely used by practitioners to check the back vertex power (BVP) of soft contact lenses. It requires a certain skill to blot the lens surfaces dry without dehydrating the lens material itself. For the same reason, measurements need to be taken within one minute, which is challenging, particularly when measuring toric soft contact lenses. Still, measurement accuracies of better than 0.25 D can be achieved. The one big advantage of this method is the direct measurement of power ‘in air’, no power conversion is required. This is in contrast to power mapping with the lens immersed in a wet cell. Several correction and conversion factors need to be applied to obtain a valid back vertex power (BVP) ‘in air’ power.7
As the front and back surface of the contact lens is in contact with the immersion solution within the parallel sided wet cell, the measured power is greatly reduced relative to the labelled ‘in air’ power. The most critical step is therefore the conversion from ‘in solution’ to ‘in air’ power. This is based on the conversion formula:
BVP air = (n lens − n air) / (n lens − n saline) × BVP solution
With solution refractive indices (n) being close to 1.334 and soft contact lens materials refractive indices ranging between 1.375 and 1.42, the resulting conversion factors can be as high as 5.5. Not only does this require that the actual wavefront measurement must be highly accurate, but it is also of critical importance that the refractive indices of the solution and the lens material are known to great accuracy. As Kim 9 demonstrated, a precision of at least 4 decimal places is needed for the refractive indices to achieve power accuracy levels of at least 0.25 D as required by ISO 18369-2. As any inaccuracies are multiplied by the lens power, high powered lenses may require even higher precision. This refractive index issue is further confounded by ambivalent definitions in the ISO standard. ISO 18369-3 specifies that the refractive index of a contact lens material is to be measured for a wavelength of 546 nm or 589 nm. This ambiguity makes it difficult for the instrument manufacturers to ensure that the provided n is valid for the wavelength used in their instrument. Fortunately, the dispersion of contact lens materials is rather small,10 and the two listed wavelengths are close together, so that the resulting error is insignificant.
Besides the refractive index issue, the power conversion is also affected by the chosen conversion algorithm.7 The simplest, but also least accurate method uses the thin lens formula. This has the advantage that no knowledge of actual parameters is required to perform the conversion. Applying the thick lens formula achieves a more accurate ‘in solution’ to ‘in-air’ conversion, but centre thickness and base curve radius need to be known and entered for each lens. The most accurate conversion method utilises the ray tracing algorithm but, again, even more geometrical parameters, such as base curve asphericity, need to be entered into the algorithm to obtain valid results.
While the use of wet cells eliminates the potential problem of lens dehydration, it increases the sensitivity to temperature fluctuations. ISO 18369-3 specifies a narrow temperature range for the solution in the wet cell of 20 °C ± 0.5 °C to minimise measurement errors. Solution temperature can directly affect the water content of the lens material and thereby change the physical size and the material refractive index.11 Some instruments rely on a temperature controlled environment to ensure compliance, while others use temperature controlled wet cells or a recirculating solution system with integrated temperature control. Besides a controlled temperature, it is also important to keep the solution clean from contamination that can interfere with the wavefront measurement.
One fundamental problem that affects all power mapping instruments and methods is the inability to obtain accurate results close to the optical centre. The measurement variability contains a 1/r factor, with ‘r’ being the distance from the optical centre. This means that for very small distances ‘r’, this factor becomes large, amplifying even the smallest measurement noise.
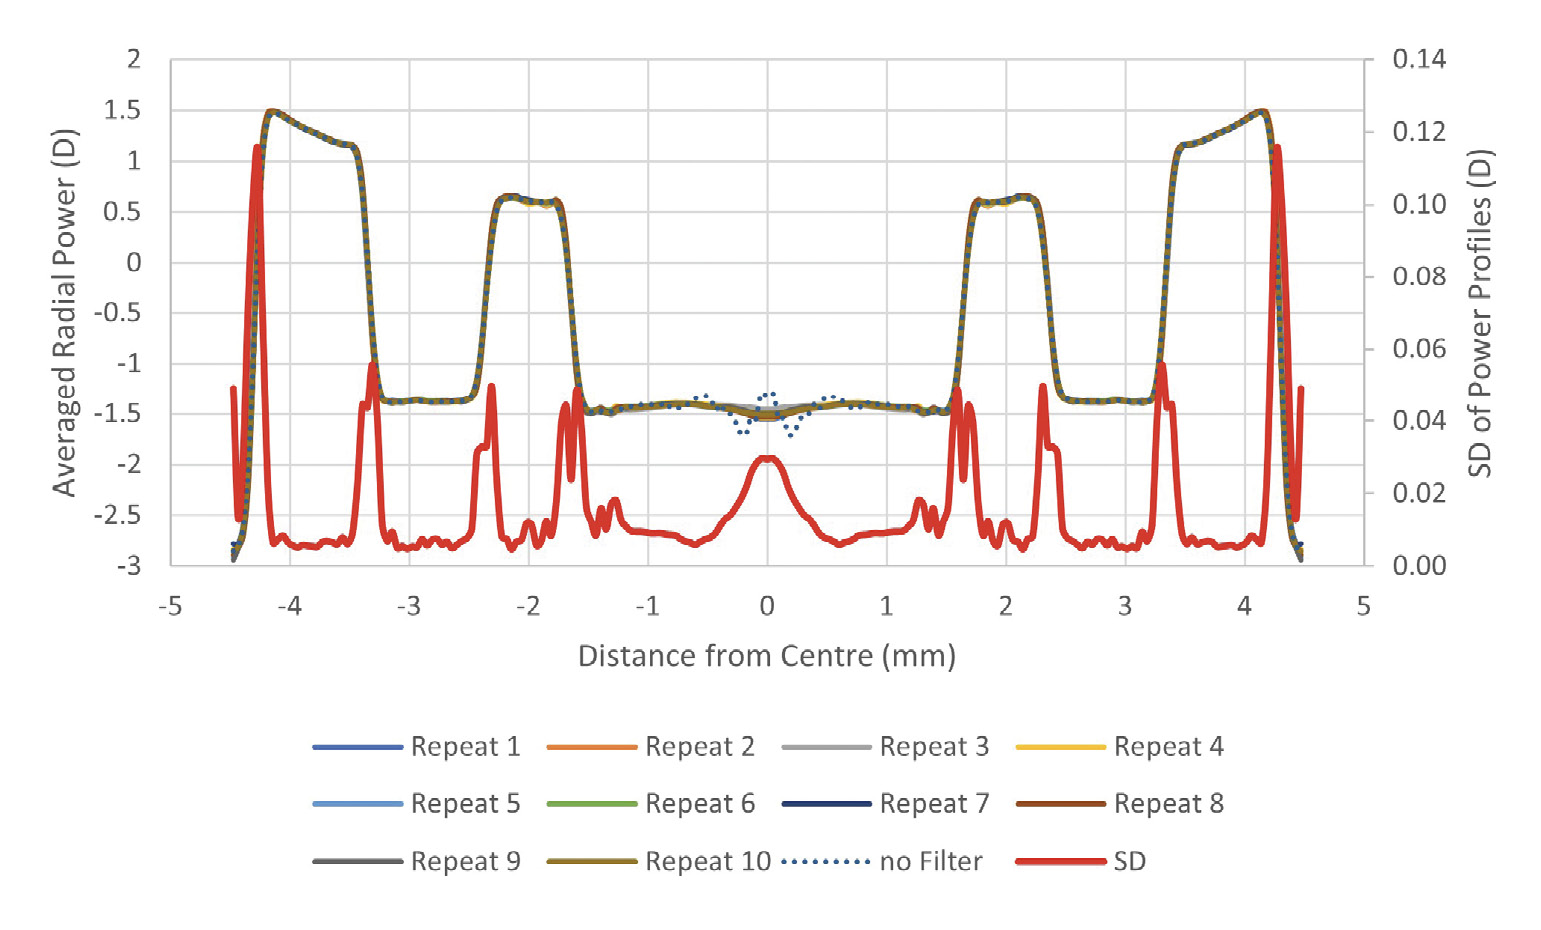
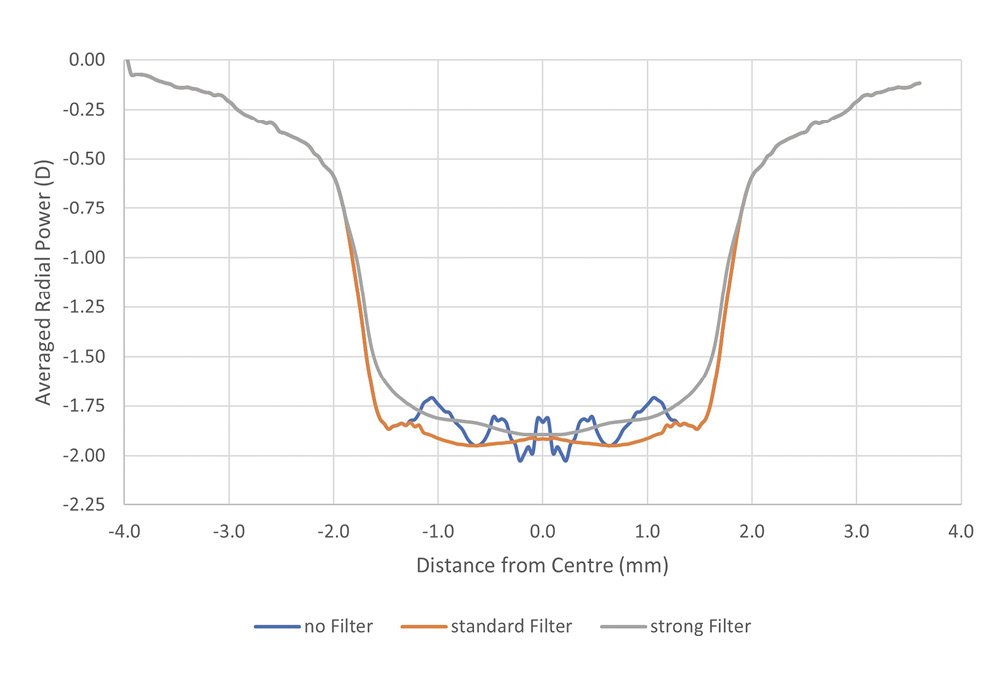
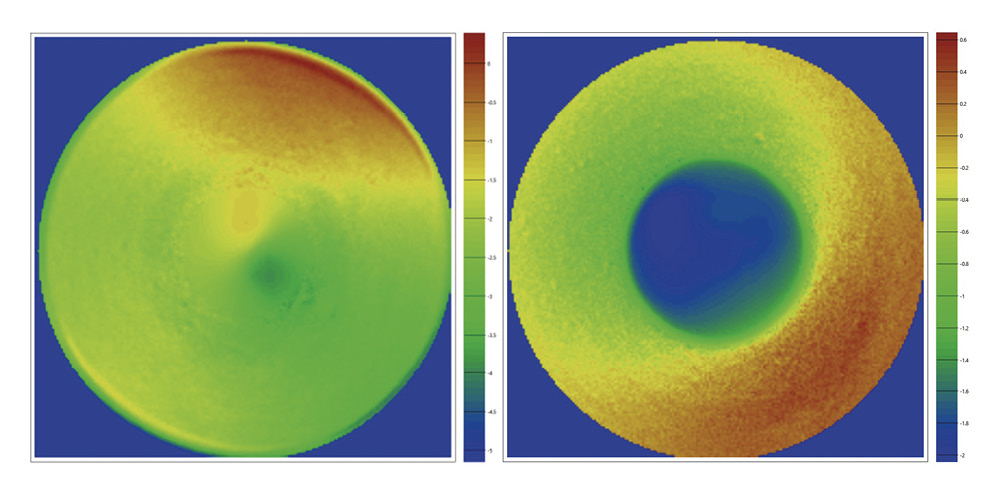
To manage this issue, all power mapping instruments have implemented algorithms in their analysis software to smoothen the central area power map by filtering and extrapolating data points from more peripheral zones. The user has some control on the amount and area of filtering by selecting certain smoothing parameters. While this produces acceptable results for single vision and toric contact lenses, important power profile information can be lost when measuring multifocal or extended depth of focus lenses. These lenses have carefully tuned power profiles particularly around the optical centre to achieve the desired visual performance. Similarly, many lathe cut and some moulded soft contact lenses show optical defects near the centre, which can go undetected due to the applied profile smoothing. As shown in Figure 2A, there is little loss in power profile fidelity for this High Add Biofinity (CooperVision, USA) lens which is designed to have a relatively flat power profile around the centre, the opposite is true for lenses with significant power variation close to the optical centre, such as the EDOF High (SEED, Japan) lens shown in Figure 2B. Here, it is difficult to distinguish between the effects of measurement noise, decentration from optical axis, and filtering, making it difficult to obtain the actual power profile of the lens. Referring back to Figure 1, this 1/r factor also explains the increase in standard deviation towards the centre of the lens even with the applied standard filter settings. The dotted line in Figure 1 illustrates the inherent measurement variability when no filter is applied to the central region. In these examples, the NIMOevo filter settings were:

Zernike polynomials have been used for many years to mathematically describe optical wavefronts in a large range of applications, including visual optics. The pyramid like structure of these polynomials provide a powerful and simple tool to analyse and present lower and higher order aberrations. Lower order aberrations hereby represent the sphere and cylinder power of a contact lens, while higher order aberrations can be used to describe spherical aberrations or to provide an optical quality classification of the lens surfaces. More advanced analysis procedures of the power map may include decentred secondary aperture to quantify local power of decentred add zones, or plotting power profiles along the azimuth, which can be useful to characterise lenses made for the correction of irregular astigmatism. Although, this is not as reliable as one would expect, as Figures 3 and 4 illustrate.
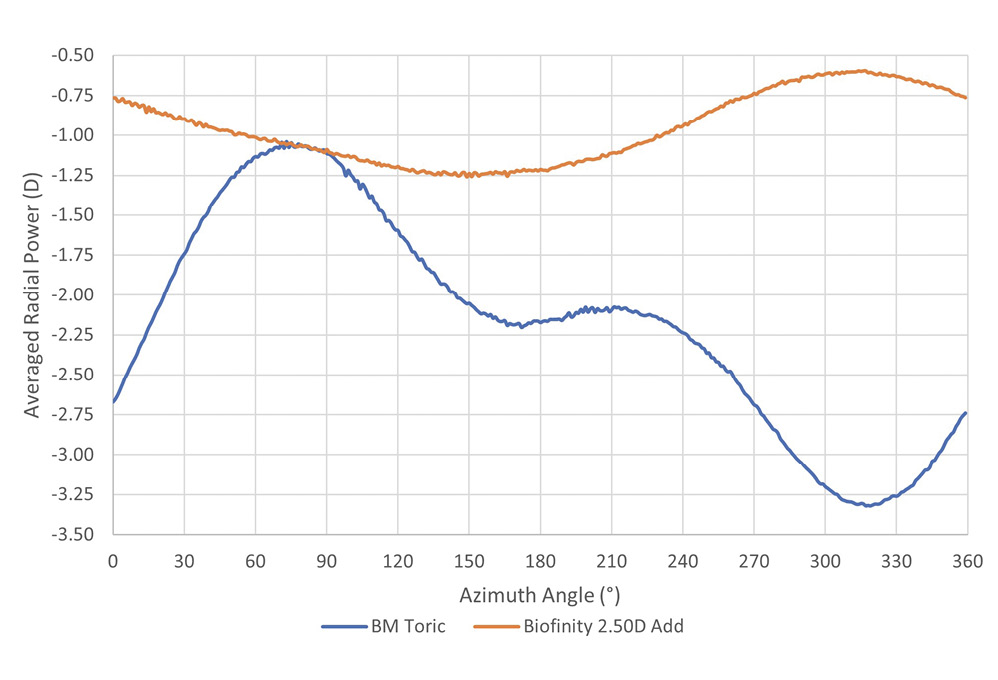
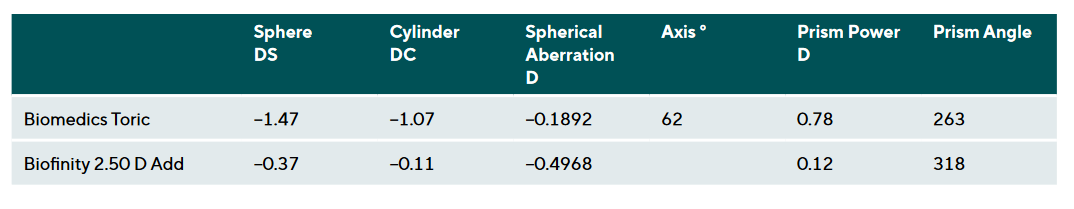
While the extracted numerical power parameters are close to the expected values (see Table 2), the power maps as well as the power profiles are difficult to interpret. The profile of the Biofinity lens should show a straight horizontal line, instead there is a cosine like wave with more than 0.50 D amplitude. The frequency of this cosine is half of what a toric lens would show, which would explain why the cylinder power has been calculated as only −0.11 DC. The Biomedics Toric (CooperVision, USA) lens does show a cosine curve with two peaks and troughs, but both amplitude and frequency are highly distorted and barely recognisable as a lens with cylinder power. Besides the already mentioned issues with accurate lens centration, measurement noise and filtration, one possible additional factor that leads to these unexpected results could be some interaction between the optical prism and the cylinder power when the instrument’s data analysis algorithm extracts Zernike polynomials from the raw data. Both lenses were measured over an optic zone diameter of 8 mm and analysed using the NIMOevo built-in function Power versus Azimuth.
Conclusions
The automated data collection as well as, largely user independent measurement procedure, has made power mapping the method of choice for most of the contact lens manufacturers. To further streamline the quality assurance process, some of the recent power mapping instruments also integrated sag and centre thickness measurements into one device.
Power mapping instruments for soft contact lenses are also a useful tool for the development and clinical evaluation of new optical designs that do not follow the conventional sphere, cylinder or multifocal design principles. For the primary eye practitioner however, these instruments would be hard to justify as their specialised analysis options would be of little benefit for the patient.
Despite their numerous advantages, there are also several limitations the user needs to be aware of to not wrongly interpret the obtained results. The provided examples illustrate some of these potential shortcomings. Although, they originate from one particular instrument, most of the described limitations are intrinsic to all of the three measurement principles, with the possible exception of the ‘Power versus Azimuth’ function.
Although efforts are underway to standardise the measurement of bifocal and multifocal contact lenses using focimeter as well as power mapping instruments, there is still no consensus on how this should be implemented.
Conflict of Interests
The author declares that there is no conflict of interests regarding the methods and devices mentioned in the article

About Klaus Ehrmann
Ph.D. - nthalmic Pty Ltd, Sydney, Australia, University of New South Wales, Sydney, Australia
Klaus Ehrmann has been working for the Brien Holden Vision Institute for 27 years before co-founding nthalmic technologies in 2019, where he currently is the Director of Technology.